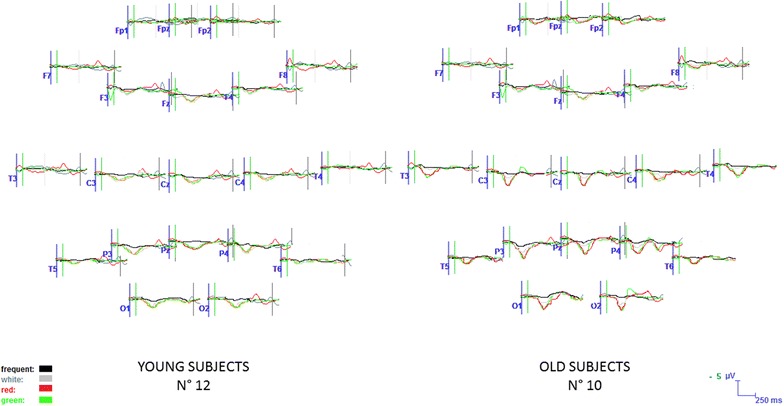
Fig. 8.

The grand average of the P3b response obtained by the target and frequent stimuli are represented on 20 representative channels in the two groups. In the old subjects, the response by the target stimulus in the White condition, represented in gray, is hardly distinguished by the response to frequent stimuli (represented in black), while the P3b by target stimuli in Red and Green conditions (represented with these colors) is clearly different from the response to the standard one. In the young subjects, the P3b by all the target stimuli is clearly recognizable from the response by the standard one
