
Fig. 2.
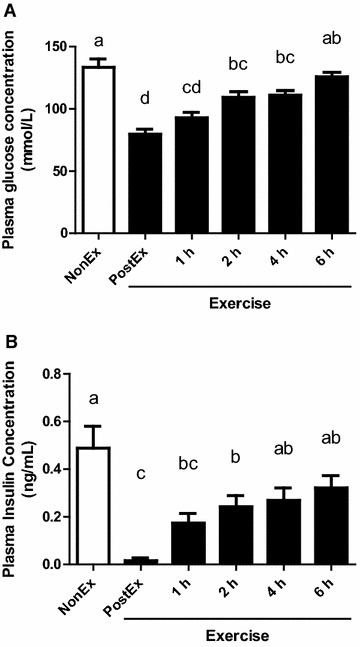
Plasma glucose (A) and insulin (B) concentrations in sedentary (NonEx; open bars) and exercised (ex; solid bars) groups of rats studied 1, 2, 4, and 6 h after dynamic exercise. Data are shown as mean ± SEM (n = 6 for the NonEx and 6 h groups, and n = 7 for the PostEx, 1 h, 2 h, and 4 h groups). Different letters denote significant difference (P < 0.05)