
Figure 4. Tuned activation of Foxo1 in Treg cells results in enhanced anti-tumor immunity without inflicting autoimmunity.
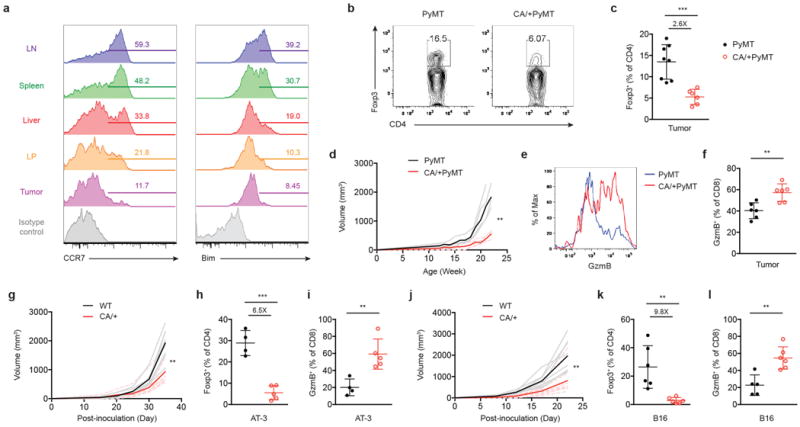
a, Flow cytometric analysis of Foxo1-activated target genes CCR7 and Bim in Treg cells from lymph node (LN), spleen, liver, colon lamina propria (LP), and tumor of 22 to 24-week-old PyMT mammary tumor-bearing mice. Numbers indicate percentage of CCR7- or Bim-positive cells shown in the gating. b, Foxp3 expression in tumor-infiltrating CD4+ T cells from 22 to 24-week-old PyMT or Foxp3CreFoxo1CA/+PyMT (CA/+PyMT) mice. c, The frequencies of Treg cells among CD4+ T cells in tumors of 22 to 24-week-old PyMT or CA/+PyMT mice (n=6-8). Number above plots indicates fold change of the mean percentage in comparison to PyMT. d, Tumor growth curve of PyMT and CA/+PyMT mice (n=4). e, Flow cytometric analysis of GzmB expression in CD8+ cells from tumors of PyMT and CA/+PyMT mice. f, The frequencies of GzmB-expressing CD8+ T cells from tumors of PyMT and CA/+PyMT mice (n=6). g-i, 8 to 10-week-old wild-type (WT) or Foxp3CreFoxo1CA/+ (CA/+) mice received orthotopic inoculation of PyMT-derived mammary tumor cells (AT-3). j-l, 8 to 10-week-old WT or CA/+ mice received subcutaneous injection of B16 melanoma cells. g, j, Tumor growth curve of WT and CA/+ mice (n=6-8). h, k, The frequencies of Treg cells among CD4+ T cells in tumors of WT and CA/+ mice (n=4-6). Numbers above plots indicate fold change of the mean percentage in comparison to WT. i, l, The frequencies of GzmB-expressing CD8+ T cells from tumors of WT and CA/+ mice (n=4-6). Results represent at least three independent experiments. Tumors of comparable sizes from different groups were used in each experiment. (c, f, h, i, k, l) unpaired t-test. Error bars represent the mean ± SEM. (d, g, j) two-way analysis of variance (ANOVA). **, p<0.01, ***, p<0.001.