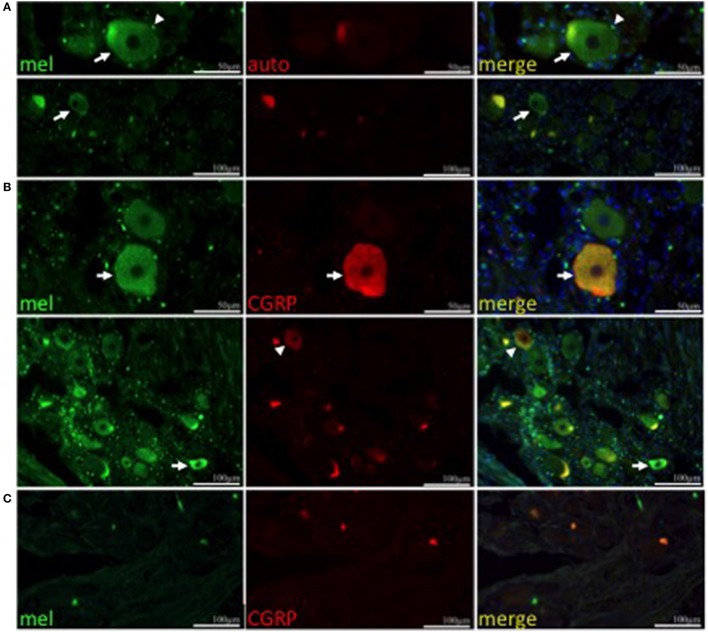
Figure 2.
Melanopsin is expressed in human TG neurons. (A) Melanopsin (green) is expressed in human TG neurons (arrow) and satellite cells (arrowhead). Autofluorescence (red) is shown. (A,B) Nuclei are shown in blue. Upper panel, scale bar = 50 μm; lower panel, scale bar = 100 μm. (B) CGRP (red) colocalizes with melanopsin (green) in a population of neurons (top panel, arrow) however some neurons are immunopositive only for CGRP (lower panel, arrowhead) or melanopsin (lower panel, arrow). (C) Negative control using secondary antibodies. Scale bar = 100 μm.

