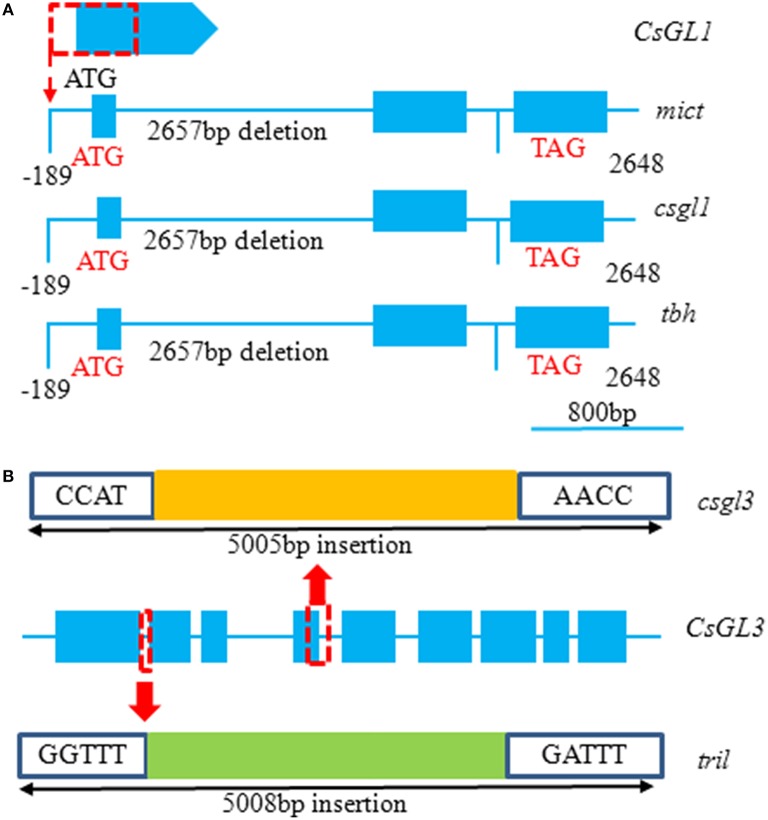
Figure 3.
Gene structure of CsGL1 and CsGL3 in the WT and mutants. (A) A 2649 bp deletion of the start codon in CsGL1 in the mict, csgl1 and tbh mutants compared to the WT. Boxes represent exons, and lines represent introns and intergenic regions. ATG and TAG indicate start and stop codons, respectively, and numbers represent nucleotide deletion length in mutants. Mict is from Zhao et al. (2015a); csgl1 is from Li et al. (2015). (B) A 5005 bp insertion at the 4th exon in csgl3 and a 5008 bp insertion after the first exon in the tril mutant. The red box indicates insertion sites, and yellow and green boxes represent insertion length. Different insertions in this gene showed the same phenotype in cucumber. tril is from Wang et al. (2016); csgl3 is from Pan et al. (2015).

