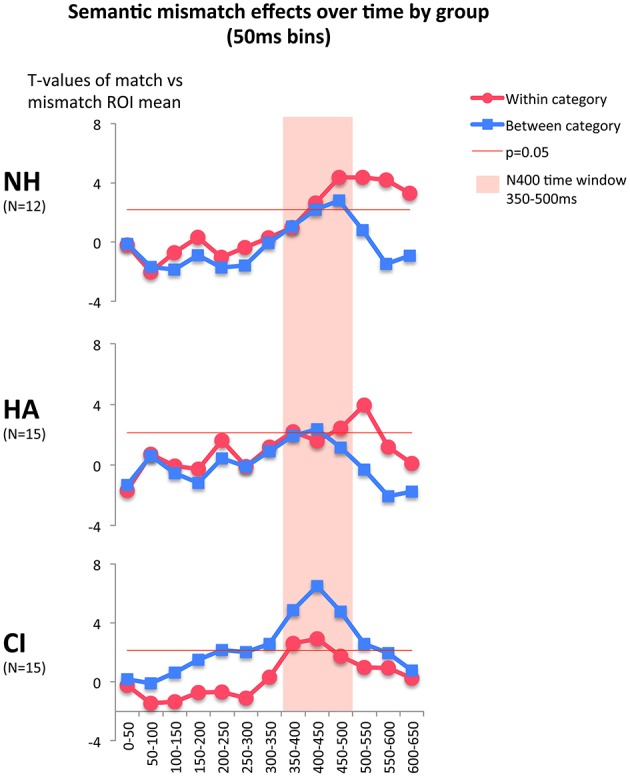
Figure 3.

Within- and between-category mismatch effects (mismatching trials compared to congruent trials) over time. T-tests based on ERP amplitude averages in 50 ms time windows in the Region of Interest (ROI). Positive threshold for p = 0.05 is shown for N = 12 (NH group) or N = 15 (HA and CI groups). A strong between-category mismatch effect is seen in children with CI, and a late within-category effect in children with NH and HA. Only the positive threshold is plotted, but one point with a negative T-value does reach the negative threshold for significance (the second red dot, 50–100 ms for NH children).
