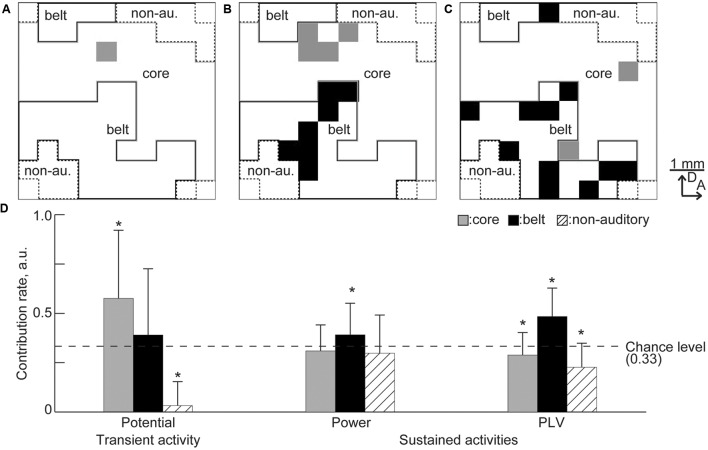
FIGURE 10.
Predominance of the cortical region in the decoding. (A–C) Representative spatial distribution of the remaining recording sites in the decoding from (A) the transient activity, (B) high-gamma power, and (C) high-gamma PLV. Gray and black squares indicate the remaining recording sites. In these representative results, there was no remaining site in the non-auditory region. (D) Contribution rate for each activity. Asterisks indicate that contribution rate was better than the chance level, i.e., 0.33: ∗p < 0.05 (Mann–Whitney U test with Bonferroni correction for three comparisons).

