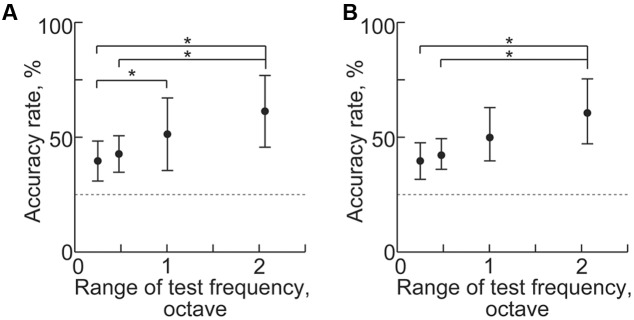
FIGURE 11.
Decoding of test frequencies in several frequency ranges. (A,B) Decoding accuracy in (A) high-gamma power and (B) PLV with respect to the range of the four test frequencies (shown in Table 1). Asterisks indicate statistical significance: ∗p < 0.05 (Wilcoxon signed-rank test).

