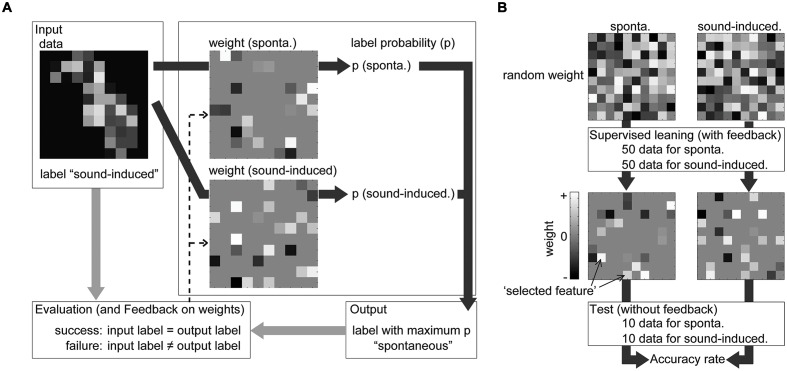
FIGURE 4.
Discrimination by SLR during supervised learning and the subsequent testing process. (A) From one input, SLR calculated and compared label probability (indicated by deep gray arrows). SLR had weight vectors equal to the tested label (in this figure, two labels) and the input value at each recording site was multiplied with the weight at the same recording site. From the summation of this multiplication of the input data and weight vectors, the softmax function calculated the ‘label probability (p)’ for each label. SLR then determined the label with the maximum label probability as the output label or discrimination result. In supervised learning, SLR renewed the weight vector (indicated by the dotted arrows) according to the comparison between the input and output label (indicated by light gray arrows). (B) The discrimination consisted of two steps: supervised learning and the testing process. After supervised learning, SLR again discriminates new samples and we obtained the accuracy rate of the discrimination and weight vector for each label.

