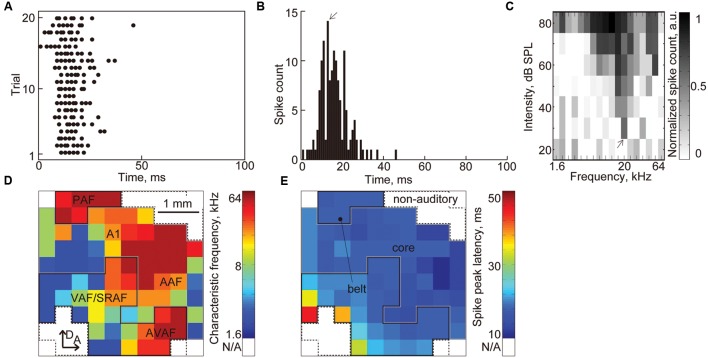
FIGURE 7.
Characterization of the auditory cortex based on the CF and spike peak latency. (A) Representative raster plot. The black dots indicate MUAs. (B) PSTH of the raster plots in (A). The arrow indicates the peak latency. (C) FRA at each recording sites. The arrow indicates the CF (20 kHz) at this recording site. (D) Tonotopic map and (E) latency map in the auditory cortex. Color map of the CF and spike peak latency at each recording site is shown. From these maps, we classified each recorded site into three functional regions: core, belt, and non-auditory region. The recording sites that had no clear CF were categorized in the non-auditory region. The borders between the core and belt regions were determined from the tonotopic gradient and spike peak latency.

