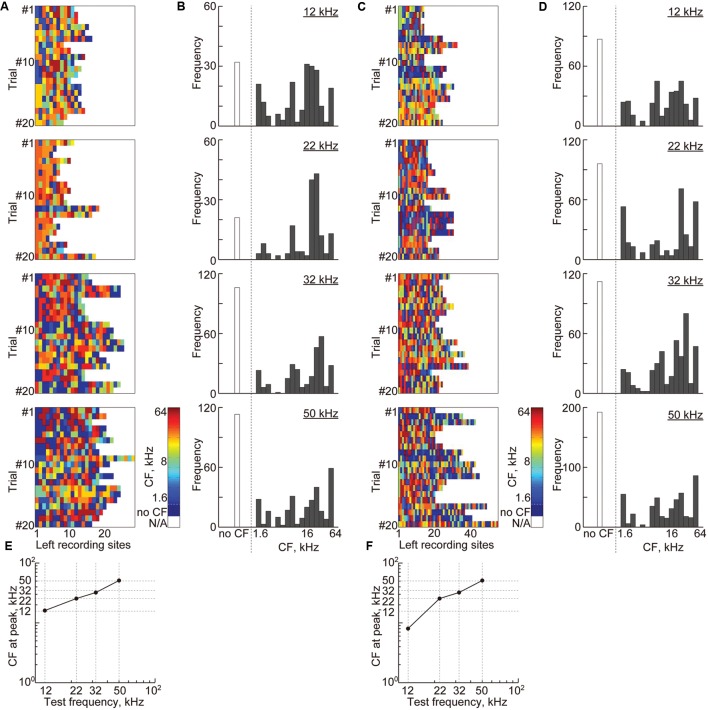
FIGURE 9.
Cortical representation of sustained activities based on characteristic frequencies. (A) Each color shows the CF at the remaining recording sites with non-zero weights in the most successful 20 discrimination trials of each test frequency from the high-gamma power. (B) The histograms of the CF shown in (A) with respect to the 18 frequencies ranging from 1.6 to 64 kHz. (C) Each color shows the CF at recording sites of the remaining features in the most successful 20 discrimination trials of each test frequency from the high-gamma PLVs. (D) The histograms of the CF shown in (C). (E,F) The CFs at the peak of the histograms with respect to the test frequencies.

