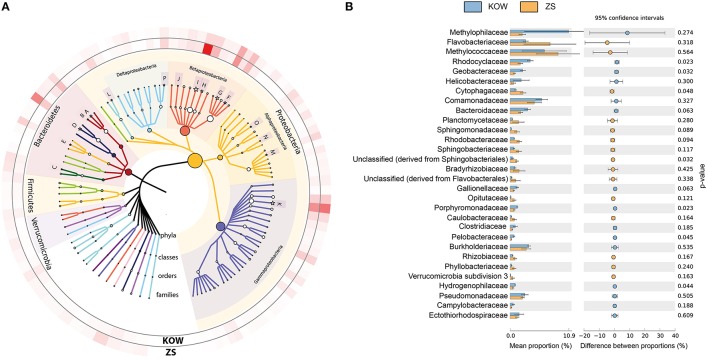
Figure 4.
Most abundant families found in the analyzed microbial mats. (A) Phylogenetic tree of the most abundant families identified in analyzed metagenomes. The size of tree node represents the abundance of a particular taxon in the analyzed metagenomes. Families with significant differences between analyzed metagenomes are marked with a star. On the outer ring, family abundances are showed as a heatmap. A, Bacteroidaceae; B, Porphyromonadaceae; C, Sphingobacteriaceae; D, Flavobacteriaceae; E, Cytophagaceae; F, Burkholderiaceae; G, Comamonadaceae; H, Rhodocyclaceae; I, Methylophilaceae; J, Hydrogenophilaceae; K, Methylococcaceae; L, Helicobacteraceae; M, Bradyrhizobiaceae; N, Sphingomonadaceae; O, Rhodobacteraceae; P, Geobacteraceae (B) Families differing in abundance between analyzed communities. p-values calculated in STAMP using Welch's test, with no correction used.

