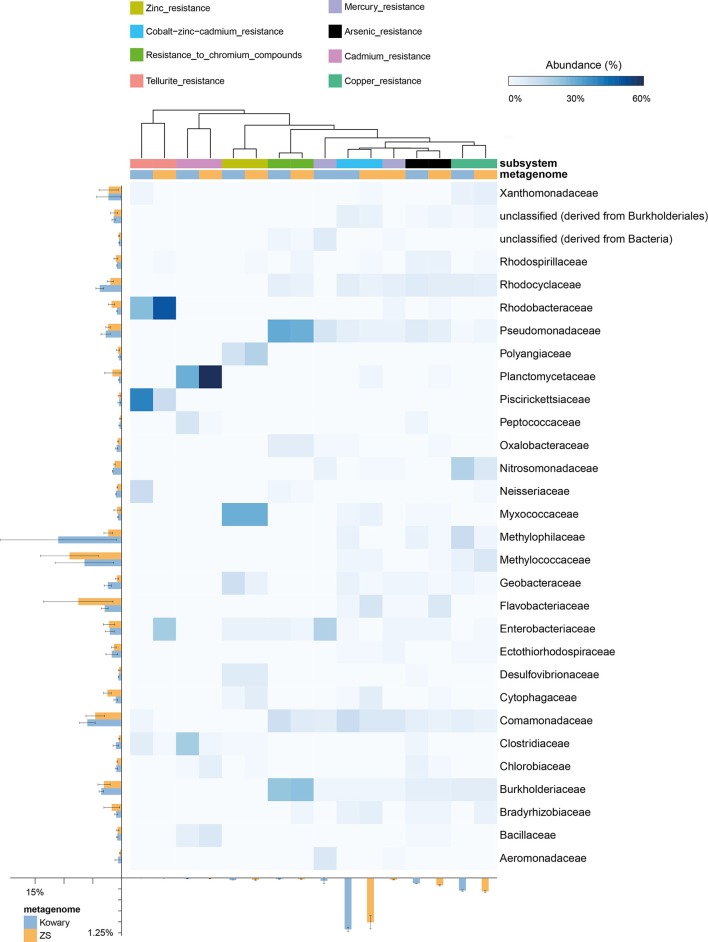
Figure 6.
Taxonomic distribution of reads assigned to heavy metal resistance subsystems. The heatmap shows relative abundance of reads classified to a given family in a particular subsystem. Total abundances in metagenomes are shown for families and subsystems on the left and at the bottom, respectively. Subsystems were clustered using the average neighbor (UPGMA) method. Mercury resistance indicates summarized data for mercuric reductase and mercury resistance operon subsystems.

