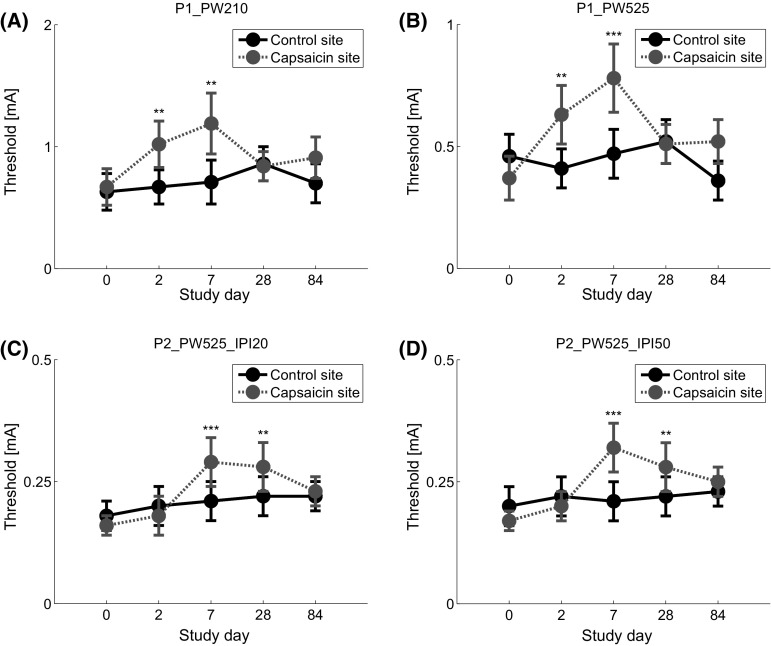
Fig. 4.
Estimated thresholds and corresponding standard errors for all four combinations of temporal stimulus properties (Table 1). *, **, and *** indicate a significant mean difference between the thresholds obtained at the capsaicin treated skin area and untreated area with a value of p < 0.05, p < 0.01, and p < 0.001, respectively. Note the difference in y axis in the four subfigures

