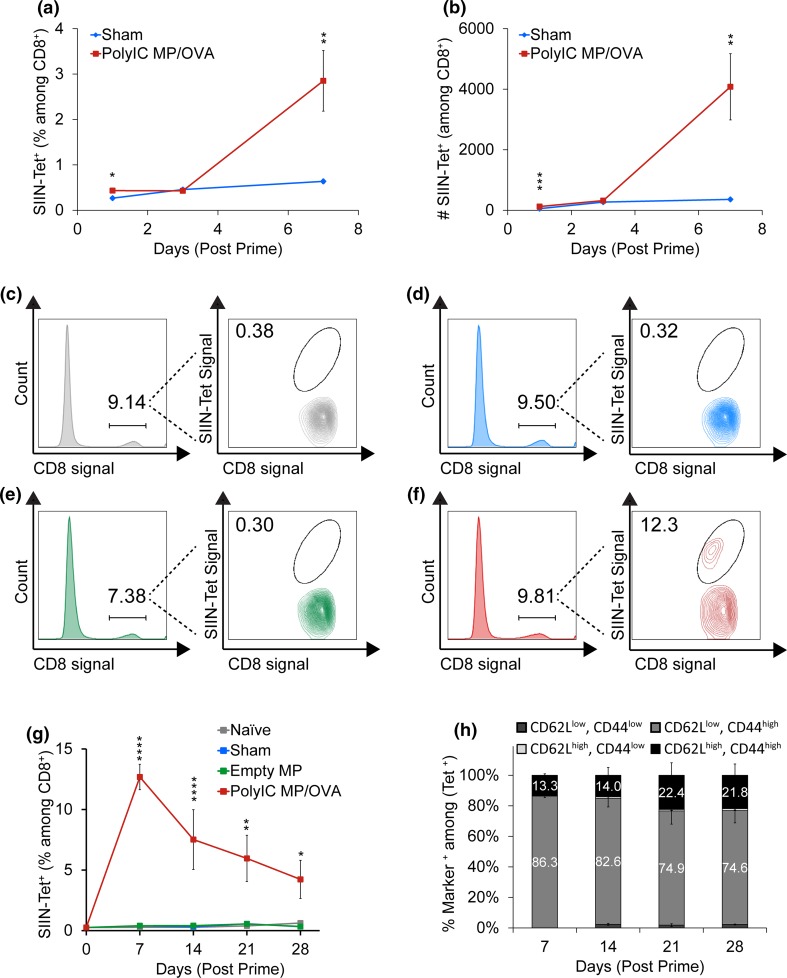
Figure 6.
i.LN. injection of depots drives antigen-specific T cell responses locally in LNs and systemically in the periphery. (a) Percentage and (b) numbers of SIINFEKL-tetramer+ CD8+ T cells in LNs at 1, 3 and 7 days after i.LN injection of PolyIC MP/OVA depots or a PBS sham injection. Numbers are counted in an identical acquisition volume (80 µL). n = 9–10 LNs per group with bars depicting mean ± SEM. (**p < 0.01; ***p < 0.001) Mice were immunized i.LN. with PolyIC MP/OVA depots, Empty MPs, a sham injection of PBS or left untreated (naïve), and leukocytes from peripheral blood were stained for SIINFEKL-tetramer+ CD8+ T cells weekly starting 7 days after immunization. Representative flow cytometry plots illustrating the gating scheme for SIINFEKL tetramer staining of untreated mice (c), mice immunized i.LN. with a sham injection of PBS (d), Empty MPs (e), or PolyIC MP/OVA depots (f) 7 days after treatment. (g) Mean percentage of SIINFEKL-tetramer positive T cells and (h) percentage of SIINFEKL positive T cells with effector (CD62Llow/CD44high) or memory phenotypes (CD62Lhigh/CD44high) in mice from treatment groups detailed in (c–f). n = 8 mice for Day 0, n = 10 mice per group at Day 7, and n = 4–5 mice per group for Days 14–28. (*p < 0.05; **p < 0.01; ***p < 0.001; ****p < 0.0001).

