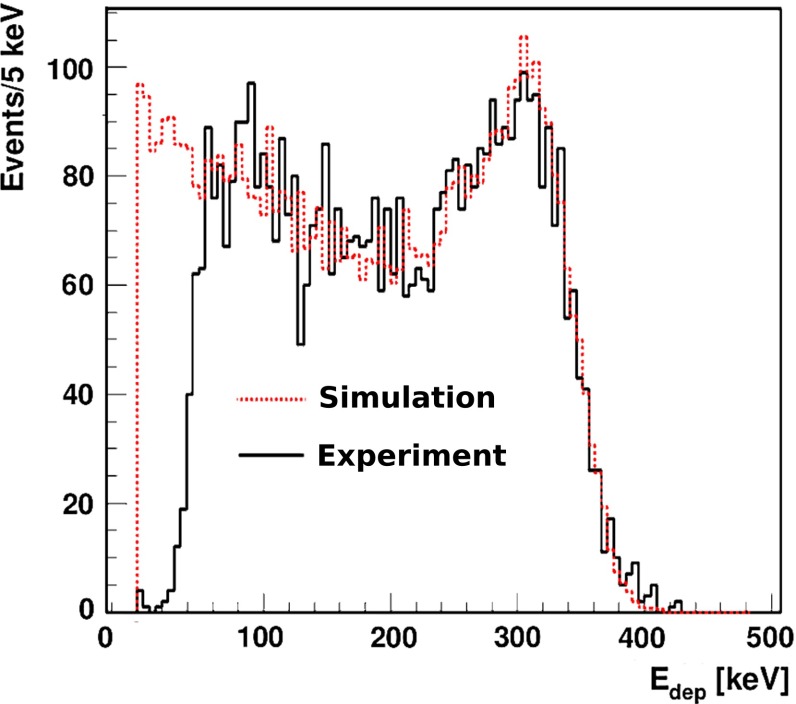
Fig. 12.
Spectra of simulated (red, dashed line) and measured energy (solid, black line) deposition by 511 keV gamma quanta in J-PET detector. The simulated spectrum was normalized to the experimental one, and simulations were performed taking into account the energy resolution (Eq. 4). The left part of the experimental spectrum was cut due to the triggering threshold applied in the experiment

