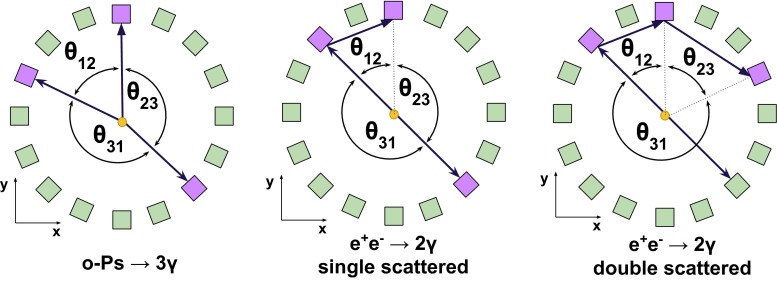
Fig. 13.
Pictorial illustration of the possible response of the detector to and annihilation into . Arranged circularly squares represents scintillator strips—purple and green colors indicate strips where the gamma quanta were or were not registered, respectively. The arrows represents gamma quanta occurring in the events, while dotted lines indicate naively reconstructed gamma quanta. Examples of primary and secondary scatterings are depicted

