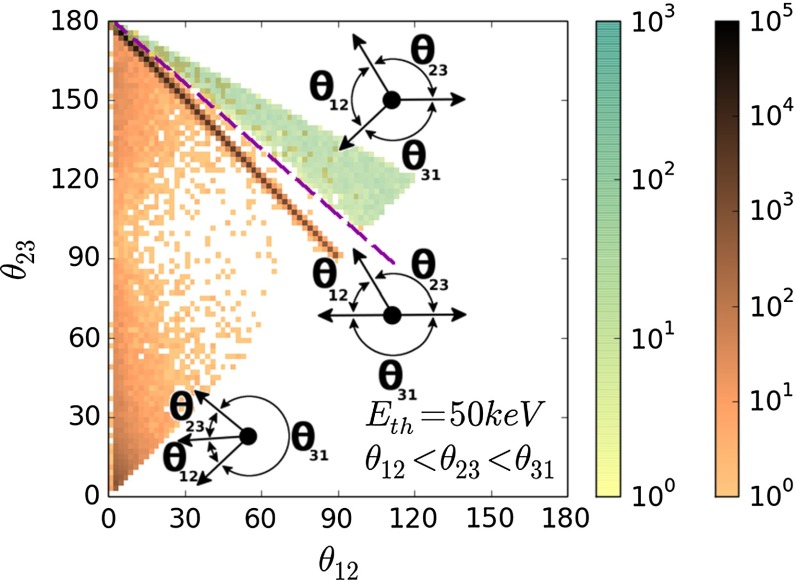
Fig. 14.
Distribution of (green) and scattered events (brown) as a function of vs angles. Events, where one of the gamma from annihilation is registered in the detector while the other is scattered and cause signals in two detectors, lies on the diagonal of the plot. Events where one gamma is missing detection, and the other undergoes two scatterings are localized below the diagonal line. Example of analysis cut, rejecting of signal and reducing background by factor , is shown as a dashed purple line. Distribution includes the angular resolution of the J-PET detector

