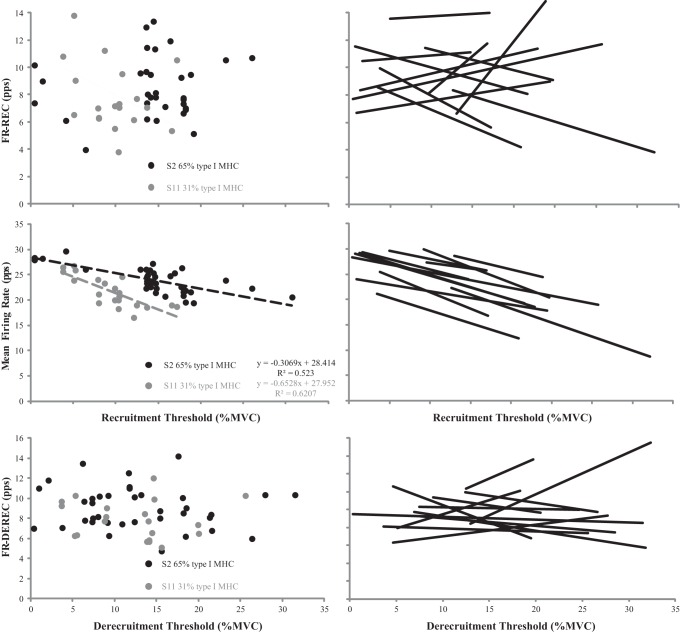
Fig. 4.
Plotted motor unit firing rates at recruitment (FR-REC) [pulses per second (pps)] vs. recruitment [% maximal voluntary contraction (%MVC)] (top), mean firing rate (pps) vs. recruitment (middle), and firing rates at derecruitment (FR-DEREC) (pps) vs. derecruitment threshold relationships (bottom) with linear regressions applied to the significant relationships for subjects 2 [65% type I myosin heavy chain (MHC)] and 11 (30% type I MHC) (left) and all subjects (black lines) (right).

