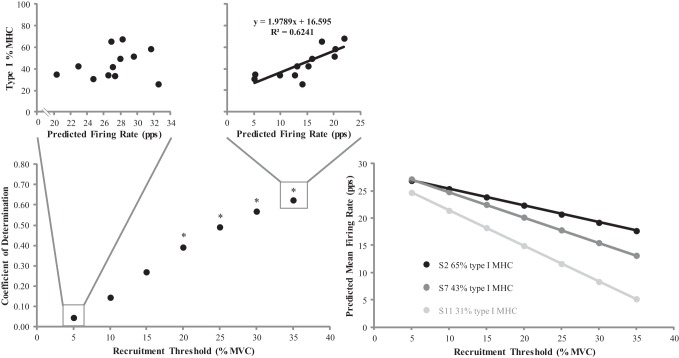
Fig. 6.
Bottom left: plotted relationships between the recruitment threshold [expressed as percent maximal voluntary contraction (%MVC)] and the coefficient of determination for the predicted firing rate [pulses per second (pps)] vs. type I % myosin heavy chain isoform content (%MHC) relationships. Top: predicted firing rates vs. type I %MHC relationships for MUs recruited at 5% (left) and 35% (right) MVC. Bottom right: plotted predicted mean firing rate vs. recruitment threshold relationships for subjects 2 (65% type I MHC), 7 (43% type I MHC), and 11 (31% type I MHC). *Significant relationship between the predicted firing rate and type I %MHC for the respective recruitment threshold (P ≤ 0.05).

