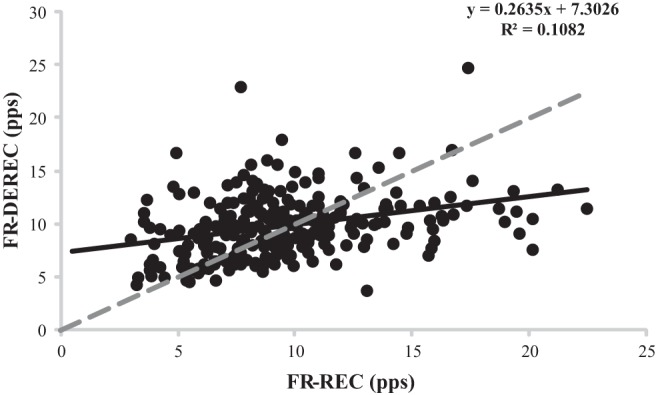
Fig. 8.

Plotted motor unit (MU) firing rates at derecruitment (FR-DEREC) vs. firing rates at recruitment (FR-REC) for all subjects. The dashed line represents a perfect relationship (y-intercept = 0, slope = 1). MUs above the dashed line had a greater FR-DEREC than FR-REC, while MUs below the dashed line exhibited the opposite behavior.
