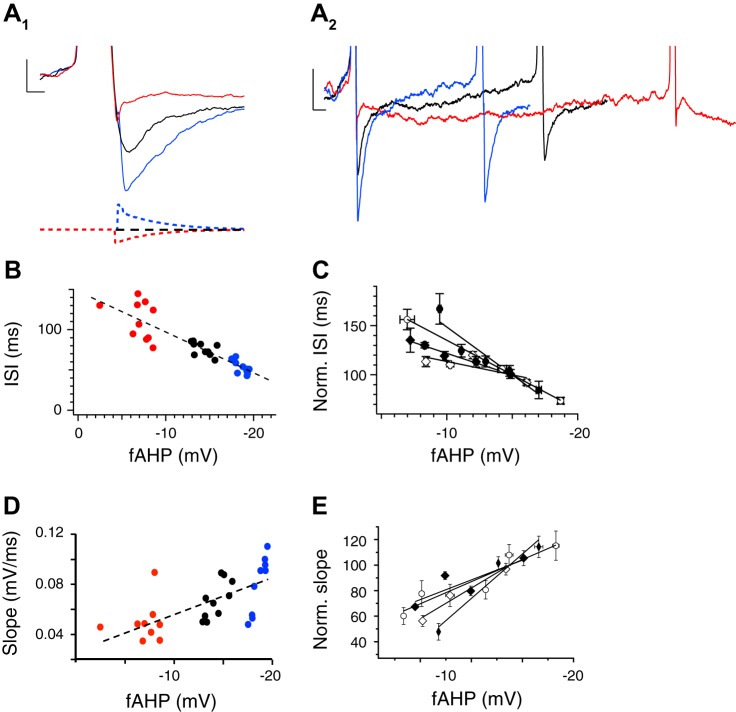
Fig. 6.
fAHP amplitude and AP frequency are correlated in β4KO neurons. A1: AP evoked by constant current injection (black trace) is compared with dynamic clamp that increases (blue) and reduces (red) fAHP amplitude. A2: expanded time scale from A1 shows effects of fAHP amplitude on ISIs. B: summary data showing an inverse correlation between fAHP amplitude and ISI for each neuron tested. C: ISI-fAHP relationship for multiple neurons (different symbols for each neuron) normalized to the ISI at the −15 mV fAHP (n = 4). D: summary data showing a correlation between fAHP amplitude and slope (mV/ms) between the fAHP and subsequent spike. The slope is measured from completion of the fAHP of the first spike to threshold of the second spike. E: relative slope-fAHP relationship for multiple neurons (different symbols for each neuron) normalized to the slope at the −15 mV fAHP (n = 4).

