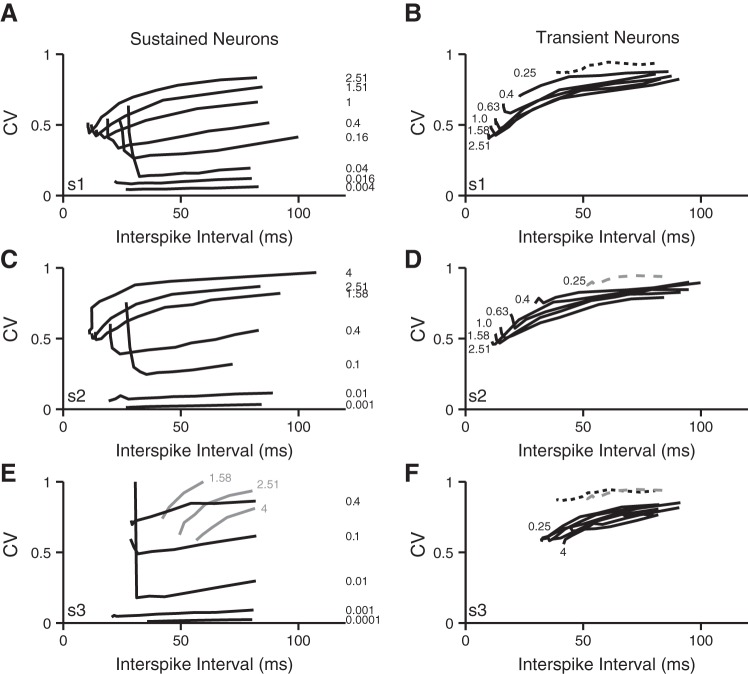
Fig. 10.
Spike-timing regularity. Graphs show the CV of interspike intervals for the spike trains evaluated in Fig. 8. In each panel, individual lines are drawn for monotonic increases in evoked firing that accompanied increases in EPSC rate for a given a fixed mean EPSC magnitude. The magnitude scale factor (relative to a mean magnitude of 150 pA) is shown next to each line. A, C, and E show the responses of the sustained-firing neuron model to the 3 EPSC shapes, respectively. B, D, and F show the response of the transient-firing neuron model to the same 3 EPSC shapes. For comparison, the responses to the EPSC trains with a ×0.25 scale factor (plotted in B and D with dashed black and gray lines, respectively) are reproduced in F.

