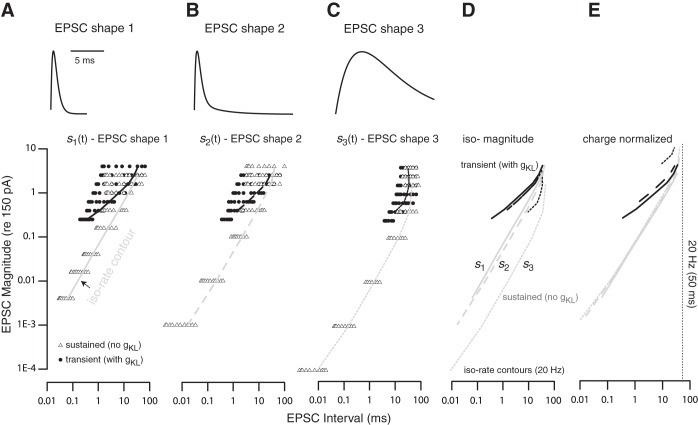
Fig. 9.
Activity response maps. Graphs show the combination of EPSC amplitude and rates that induced spiking in modeled sustained-firing neurons (gKL = 0 mS/cm2, gNa = 13 mS/cm2; triangles) and transient-firing neurons (gKL = 1.1 mS/cm2, gNa = 13 mS/cm2; circles). A–C: differences in the response maps for each of 3 different EPSC shapes (insets at top) show that the magnitudes and intervals necessary to evoke firing activity depend on EPSC shape. Black and gray lines drawn on the response maps of transient-and sustained-firing neurons, respectively, indicate the EPSC magnitude and interval combinations that evoked an average spike rate of 20 Hz (iso-rate contours). D: comparison of the iso-rate contours from A–C. At any fixed EPSC interval, the transient-firing model neuron required larger EPSC magnitudes to respond with the same average rate. This current threshold was not greatly influenced by the shape of the EPSC. For the sustained-firing model, the EPSC magnitude required to induce spiking was smaller for s2(t) and s3(t) than for s1(t). E: iso-rate contours for s2(t) and s3(t) are scaled by 1.5 and 10 (shifted up the y-axis) to account for the difference in charge between them and the EPSC defined by s1(t). Note that the units of the abscissa in A should be read as a charge-normalized scale relative to charge in s1(t) for E. Iso-rate contours for the sustained-spiking model largely overlap, whereas the contours for the transient-spiking model are nonoverlapping and contract for the temporally extended stimuli.

