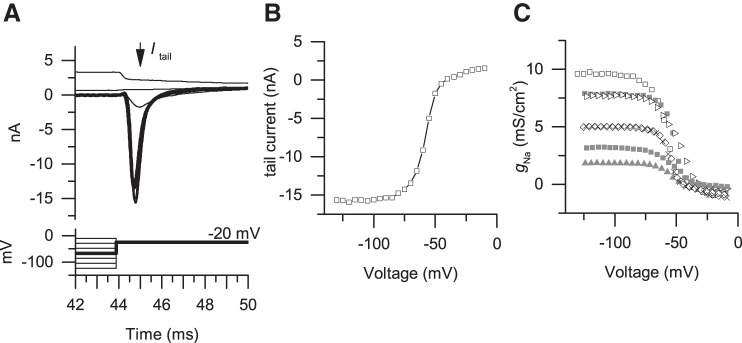
Fig. A5.
Sodium currents inferred from whole cell recordings of second postnatal week VGN. Data were collected at the same time as the data reported in Kalluri et al. 2010. A: transient inward currents induced by a series of voltage steps (bottom). B: the voltage dependence of sodium channel inactivation is characterized by plotting the maximum inward current measured during the −20-mV step as a function of the prepulse voltage. C: sodium conductance density computed by dividing the voltage-dependent sodium inactivation curves (as in B) by an estimate of sodium driving force (−20 to 87 mV, where −87 mV is the estimated reversal potential for sodium channels in this preparation). Conductance curves are shown for 7 VGN ranging in age from P11 to P14 (solid vs. open symbols indicate neurons with sustained vs. transient firing patterns).

