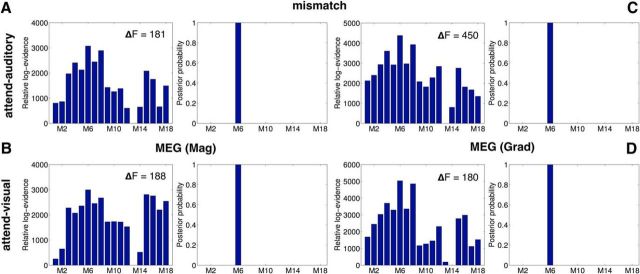
Figure 6.
DCM of the mismatch effect ERFs. Panels plot the relative log-evidence and results of FFX BMS over the DCMs in Figure 4B in their ability to model the mismatch effect contrast in the MEG data (A, B, magnetometers; C, D, gradiometers), in the attend-auditory and attend-visual conditions, respectively (Fig. 3). As with the EEG data, model M6 was the winning model of the mismatch effect in both MEG modalities and attention conditions.

