
Figure 3.
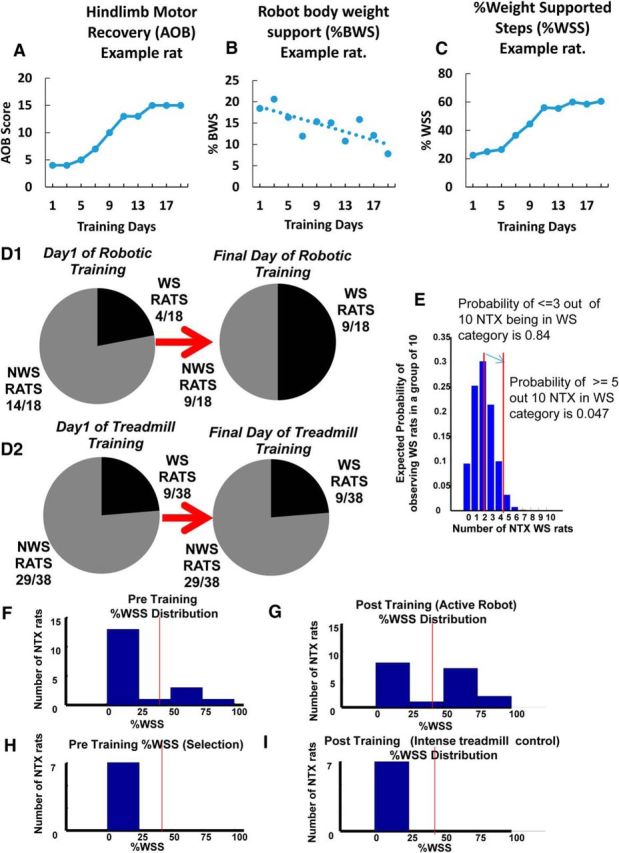
Some rats initially classified as non–weight-supporting before training with robotic rehabilitation training showed a transition to a weight-supporting classification. A–C, An example of AOB (A), %BWS (B), and %WSS (C) recovery progressions for a particular rat that transitioned from a non–weight-supporting category (<50%WSS) to a weight-supporting category (>50%WSS) over the course of training. As shown in C, this particular rat had <50%WSS on training day 1 and increased to >50%WSS over the training period. A sigmoidal pattern of recovery progression is also seen in the AOB and %WSS measures (A, C). D1, On the first day of training, 14 of the 18 rats that received robotic rehabilitation training (∼78%) were initially classified as non–weight-supporting before training, whereas the remaining 4 rats (∼22%) were classified as weight-supporting. On the final day of training, 5 of the 14 non–weight-supporting rats transitioned to a weight-supporting category, thus increasing the proportion of rats in the WS classification from 22% to 50%. Based on these observations, and to further understand the training effects of our robot rehabilitation, we grouped together these 5 originally non–weight-supporting rats that then transitioned to weight support with training as a TWS rat group (n = 5). The originally weight-supporting rats were grouped as WS rats (n = 4), whereas the originally non–weight-supporting rats that failed to transition with training were grouped as NTWS (n = 9). D2, In contrast to D1, there were no changes in weight support classifications following low-intensity treadmill-only training for any of the 29 non–weight-supporting and 9 weight-supporting implanted control rats on the last day of training. E, Z-score statistic for the last versus first training day distributions of weight-supporting rats (*p < 0.05) and a simulated distribution of expected numbers of NTX WS in a sample of 10 rats selected by chance from NTX rats based on a 20% chance of WS in the NTX population. The number of rats that transitioned from non-weight support to weight support categories increased the number of weight support classified rats at the end of training by far greater than could be expected by chance in a random sampling of a typical binomial distribution of neonatal transected rats. In 18 NTX rats, after training 9 were WS (i.e., 5/10). The probability of 5/10 rats by chance is 0.04 (i.e., p < 0.05). Based on the D2 distribution, the probability of observing 9 of 18 rats to be in the WS category by chance is 0.009. Further, we know the original distribution before training was typical and closely resembled an independent control group of 38 NTX rats in D2, all of which remained stable over time. The data are consistent with and support an accelerated %WSS improvement seen in the TWS group that facilitated transition from a non–weight-supporting classification to a weight-supporting classification with training. F, Histogram showing %WSS distribution for all robot-rehabilitated NTX rats before robotic training. Vertical line indicates the separation of WS and NWS rats with a “no man's land” of low likelihood between. G, Histogram showing %WSS distribution for all robot-rehabilitated NTX rats after training (robot-active) TWS rats moved to >50% and thus increase the number of WS and reduce the NWS number compared with the initial pretraining distribution shown in F for the same animals. H, Histogram showing %WSS distribution for the control group of 7 matched treadmill-only trained NWS NTX rats before treadmill training. Vertical line indicates the separation of WS and NWS rats. I, Histogram showing %WSS distribution for the control group of 7 matched treadmill-only trained NTX rats after training. In the 7 NTX NWS-matched control rats, there is no change in %WSS distribution following treadmill-only training similar to the training intensity of the robot-rehabilitated NTX rats.