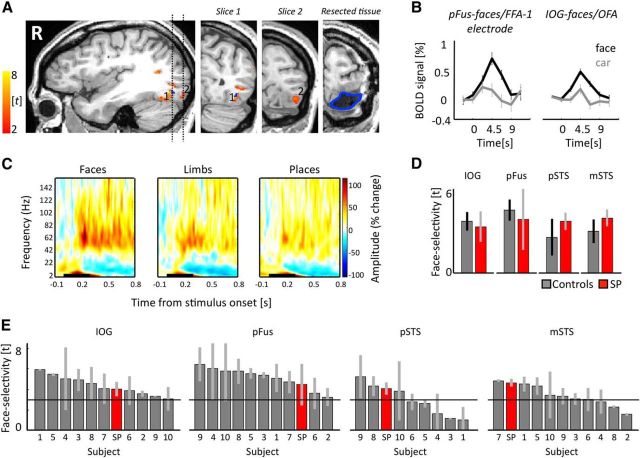
Figure 3.
The face network is typical before surgery. A, Regions illustrating face-selective responses (t > 3) before surgery. Blue represents intracerebral electrode within pFus-faces/FFA-1. Dotted lines indicate location of the two coronal slices shown on the right two panels. 1, pFus-faces/FFA-1; 2, IOG-faces/OFA. Blue outline indicates resected tissue on post-resection anatomy in similar position as slice at left. B, fMRI response under electrode and from IOG-faces/OFA from an independent experiment. Error bars indicate SEM across runs. C, Time-frequency responses of pFus-faces/FFA-1 electrode. Signal amplitude (% change from baseline) is averaged across trials and category. Black line indicates stimulus ON window (300 ms). High-frequency broadband responses showed significantly higher (p < 0.005) power to faces compared with limbs or places 150 ms after stimulus onset. D, Mean face selectivity in controls (gray) and Patient S.P. (red) in the IOG (N = 10), pFus (N = 10), pSTS (N = 8), and mSTS (N = 10). Error bars for controls indicate mean and SD between runs averaged across subjects. Error bars for Patient S.P. indicate SD across 4 independent pre-resection runs. E, Mean and SD of face selectivity in individual controls (gray) and Patient S.P. (red) in the IOG (N = 10), pFus (N = 10), pSTS (N = 8), and mSTS (N = 10). Each bar indicates data from one participant. The x-axis is ranked in a descending order to indicate where Patient S.P. falls in the distribution of typical participants. Error bars indicate SD between runs. Solid black line indicates the statistical threshold (t > 3) used to define each region from independent data.

