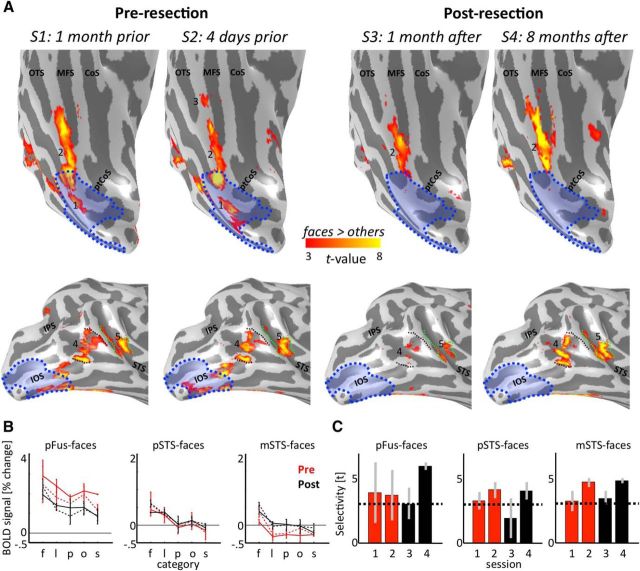
Figure 4.
The face network is stable after resection. A, The face network before and after resection on the inflated cortical reconstruction of the right hemisphere of Patient S.P. before resection. 1, IOG-faces/OFA; 2, pFus-faces/FFA-1; 3, mFus-faces/FFA-2; 4, pSTS-faces; 5, mSTS-faces. IOG-faces/OFA (1) and the posterior portion of pFus-faces/FFA-1 (2) have been resected. Blue shading represents resected cortex. Black represents superior and inferior extent of pSTS-faces in S1. Green represents posterior and anterior extent of mSTS-faces in S1. The unnumbered region on the lateral surface overlapping the IOS was also partially resected, but this region is not typically included in models of the face network because it exhibits comparable selectivity with other animate stimuli (see Materials and Methods). B, Mean fMRI response amplitude (% change) as a function of category in face-selective regions before (red) and after (black) resection. Error bars indicate SDs across runs in each session. S1, S3, Solid. S2, S4, Dotted. f, Faces; l, limbs; p, places; o, objects; s, scrambled. Conditions are ordered by rank. C, Face selectivity as a function of session. Error bars indicate mean selectivity across voxels of independently defined ROIs for run 1 and run 2 in each session. Error bars indicate SDs across runs in each session. Dotted line indicates the statistical threshold (t > 3) used to define each region from independent data. CoS, Collateral sulcus; IOS, inferior occipital sulcus; IPS, intraparietal sulcus; MFS, mid-fusiform sulcus; OTS, occipitotemporal sulcus; ptCoS, posterior transverse collateral sulcus.

