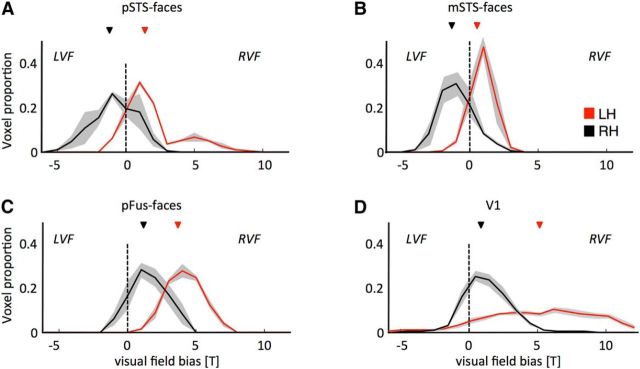
Figure 7.
Typical contralateral bias in the superior temporal sulcus, but atypical ipsilateral bias in the fusiform gyrus and V1, after removal of IOG-faces/OFA. Histograms represent the proportion of voxels biased to the right visual field (positive t value) or the left visual field (negative t value) for functional ROIs in the right (black) and left (red) hemispheres. pSTS-faces and mSTS-faces in the resected hemisphere have the typical contralateral bias displayed by visual areas, whereas pFus-faces and V1 in the resected hemisphere have an unexpected ipsilateral bias. A, pSTS-faces. B, mSTS-faces. C, pFus-faces. D, V1. LH, Left hemisphere; LVF, left visual field; RH, right hemisphere; RVF, right visual field. Light gray shading represents SE across voxels.

