Figure 1.
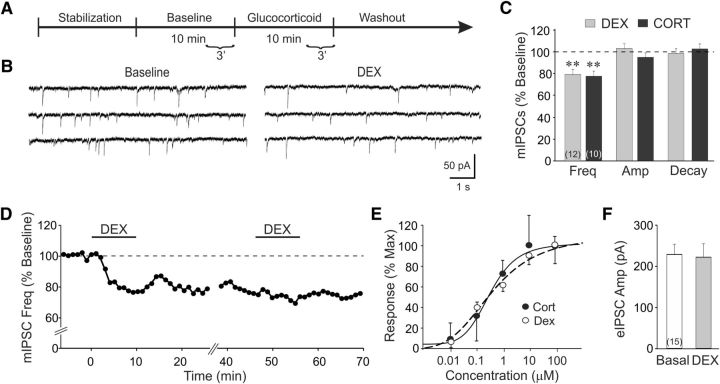
Rapid glucocorticoid induction of a long-lasting suppression of synaptic inhibition in BLA neurons. A, Timeline of the whole-cell recording experimental paradigm. The last 3 min of baseline and glucocorticoid application were used for normalization and calculation of percentage changes. B, mIPSC recording in control medium and DEX (1 μm) in a BLA neuron. DEX elicited a decrease in the frequency of mIPSCs compared with baseline. C, Mean values of mIPSC frequency, amplitude, and decay time with respect to baseline values (dashed line) following DEX (1 μm) and CORT (1 μm) application. D, Time course in a representative BLA neuron of relative changes in mIPSC frequency elicited by two successive applications of DEX. Each data point represents the mIPSC frequency over a 1 min period relative to baseline, designated by the dashed line. E, Concentration–response curves of the CORT-induced and DEX-induced decreases in mIPSC frequency relative to the maximal response (EC50: CORT, 350 nm; DEX, 384 nm). F, The mean amplitudes of eIPSCs (eIPSC Amp) recorded before (Basal) and after DEX (1 μm) application (DEX). **p < 0.01; numbers in parentheses in bar graphs represent numbers of BLA neurons included in each group.

