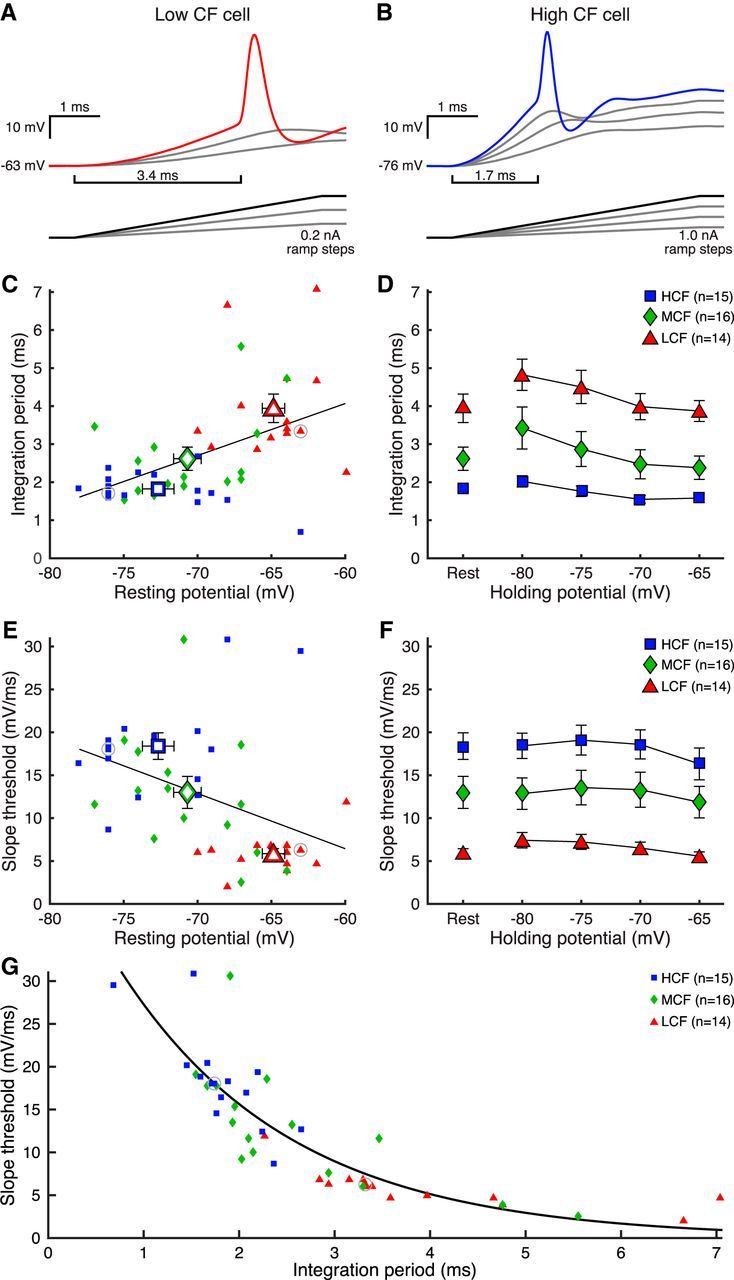
Figure 3.

Integration period and slope threshold of NM neurons are tonotopically distributed. A, B, Membrane voltage in response to ramp current injection (insets) for LCF and HCF representative cells. Brackets represent duration of integration period. C, Resting membrane potential versus integration period for LCF (triangles), MCF (diamonds), and HCF (squares) cells. Data are fitted with a least-squares regression. White-filled centroids represent means for each population. Gray circles represent cells in A, B. D, Integration period data of cells at rest in C (left) and at adjusted VH (right). Integration period was shortest for HCF cells and narrowed with depolarized VH for all populations. E, Resting membrane potential versus voltage slope threshold for LCF, MCF, and HCF cells. Data are fitted with a least-squares regression. White-filled centroids represent means for each population. Gray circles represent cells in A, B. F, Slope threshold data of cells at rest in E (left), and at adjusted VH (right). Slope threshold was steepest for HCF cells, and VH-dependent changes were minimal and not systematic. G, Integration period versus slope threshold for data in C, E, fit with a single exponential curve. Gray circles represent cells in A, B.
