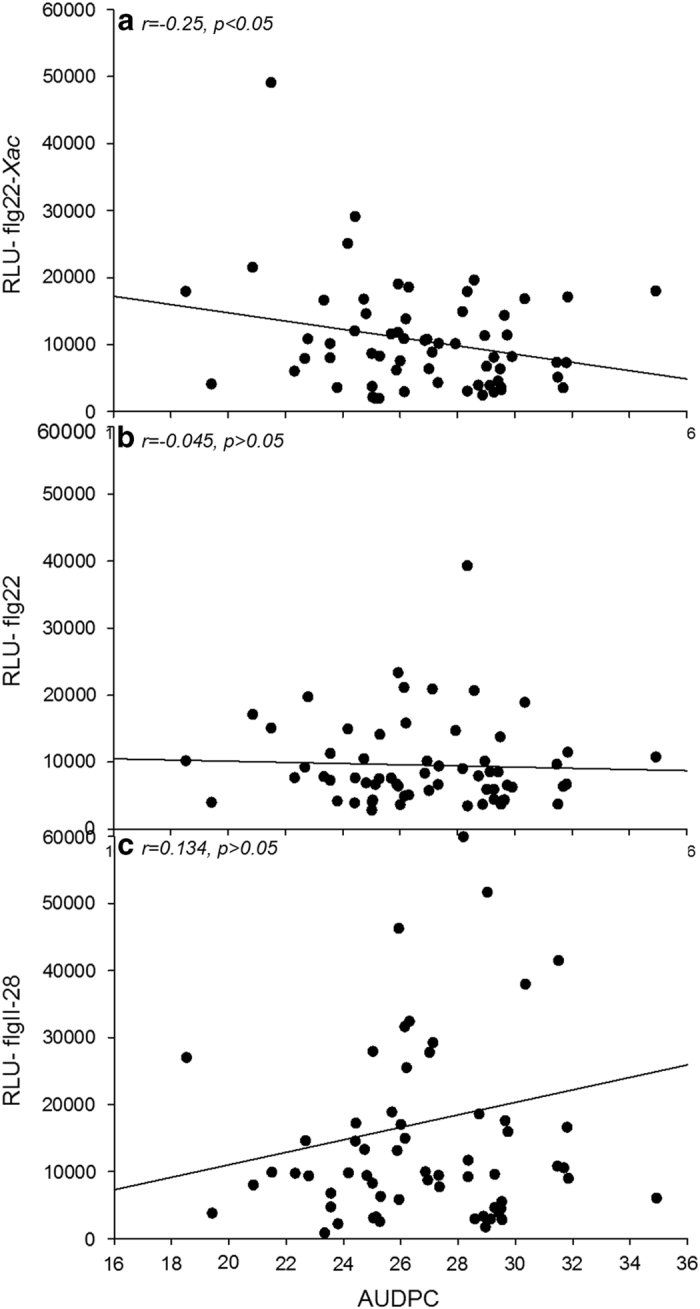
Figure 2.

Correlation between area under disease progress curve (AUDPC) scores and relative light units (RLUs) used to assess reactive oxygen species (ROS) production in response to (a) Xanthomonas-specific flagellin 22 (flg22-Xac) (b) flagellin 22 (flg22) and (c) flagellin II-28 (flgII-28). AUDPC scores were calculated using Horsfall–Barratt scale and ROS (in RLUs) was measured over 15 cycles (each cycle ~4 min) for all tomato lines in this study. ROS was measured in a luminometer as described in Materials and Methods.
