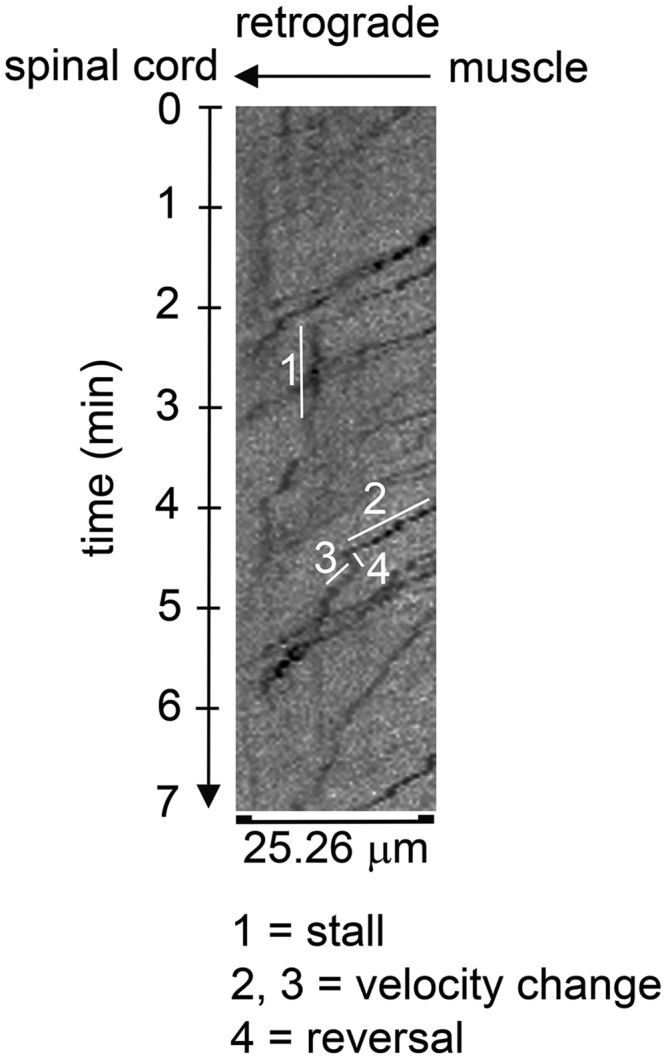
Figure 1.

Representative kymograph showing various trafficking perturbations measured. Endosomal traces are seen as dark irregular lines that typically slope downward from right to left, indicating the time it takes for a given endosome to traverse a given length (25.26 μm) of axon. Note that the slope of the trace can change over time, going from a downward slope to one that is vertical (parallel to the time axis) indicating a stall (1), to less severe changes in slope (2 vs 3), with the steeper downward slope (3) indicating a transient increase in endosomal velocity. A negative slope in an endosomal trace (4) indicates that the endosome transiently reversed its direction of movement. The shown kymograph is taken from a healthy Tfm male.
