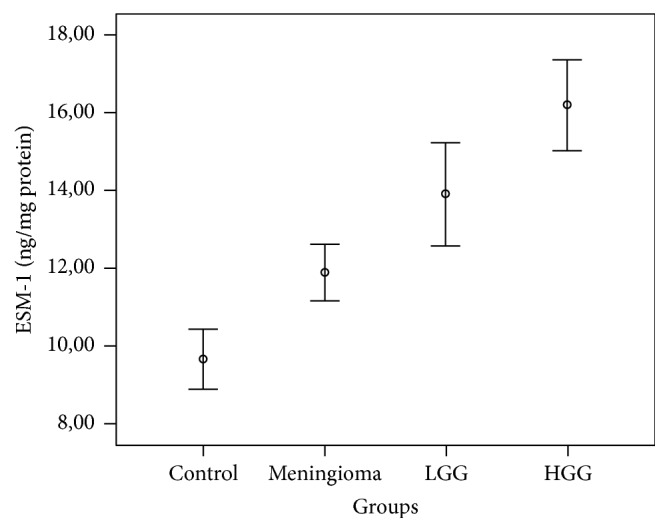
Figure 1.

Graph showing a comparison of levels of endothelial cell-specific molecule-1 (ESM-1) in the groups and the differences between all four groups were significant (p < 0.05). Circles represent the means ± standard errors of the means and bars denote the range of values.
