
Figure 1.
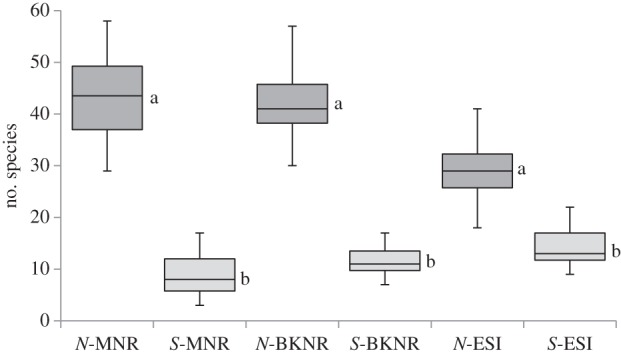
Plant species richness per nested plot (78.5 m2) for natural (N) and secondary (S) grasslands for each study area. Montane sites: MNR (n = 16 per treatment), BKNR (n = 12 per treatment). Coastal site: ESI (n = 32 per treatment). For all box-whisker plots, whiskers show maximum and minimum values, boxes show medians and quartiles.