
Figure 5.
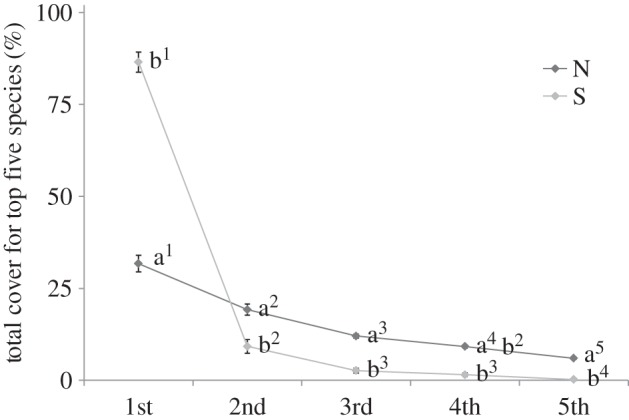
Average total percentage cover for each of the five top-ranked species per plot for each vegetative treatment: N, natural; S, secondary. Numbers on the x-axis indicate species rank, 1st = species with greatest cover, 2nd = next greatest, etc.