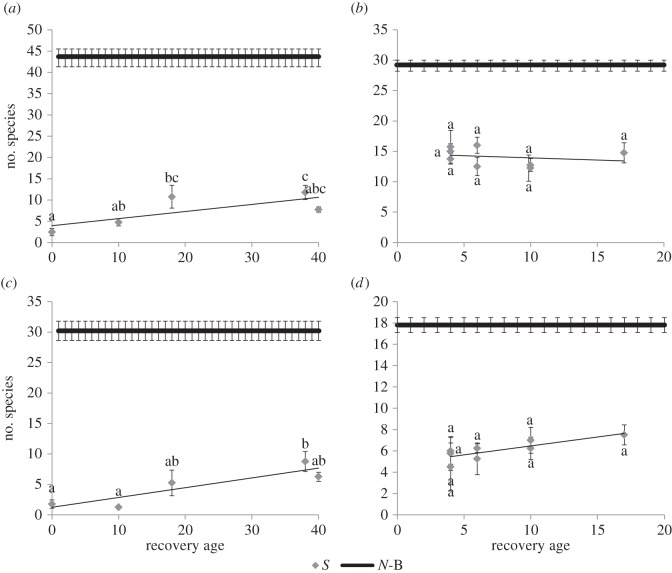
Figure 7.
Change in species richness with increasing time since deforestation for MNR (a,c—40 years) and ESI study areas (b,d—20 years). Panels (a,b) show total species richness with time and (c,d) show forb species richness with time: (a) R2 = 0.43, p < 0.0005, (b) R2 = 0.00, p = 0.88, (c) R2 = 0.50, p < 0.0001, (d) R2 = 0.04, p = 0.30). The solid line (N-B) indicates the average number of species for natural treatments and the grey diamonds (S) indicate averages for secondary treatments.

