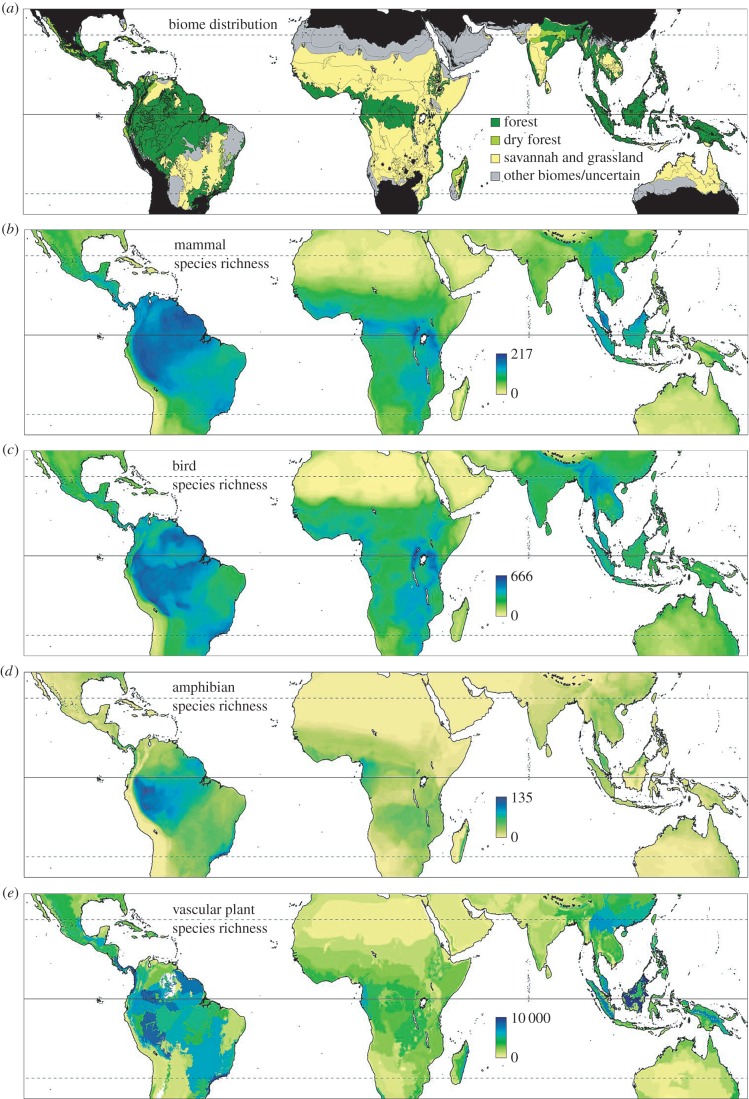
Figure 2.
(a) The broad distribution of forest, dry forest and grassy biomes in tropical climate zones, defined here as having minimum monthly temperature greater than or equal to 15°C. Areas outside the tropical climate zones are shaded black. The biome map is generally based on the ‘ecoregions’ of Olson et al. [41]—with each ecoregion allocated a dominant biome (see the electronic supplementary material, appendix S1). Boundaries between ecoregions are indicated by fine black lines. Variation in the species richness of mammals, birds, amphibians and vascular plants throughout the land areas of the tropics are shown in panels (b–e). The vertebrate species richness data relate to total mean species richness for 10 × 10 km cells, and are from Jenkins et al. [5]. The plant data relate to species richness of each ecoregion, and are from Kier et al. [35]. In (e), there are two white patches in South America, where plant richness data were not available. The solid black line indicates the Equator and the dashed lines indicate the Tropic of Cancer and Tropic of Capricorn.

