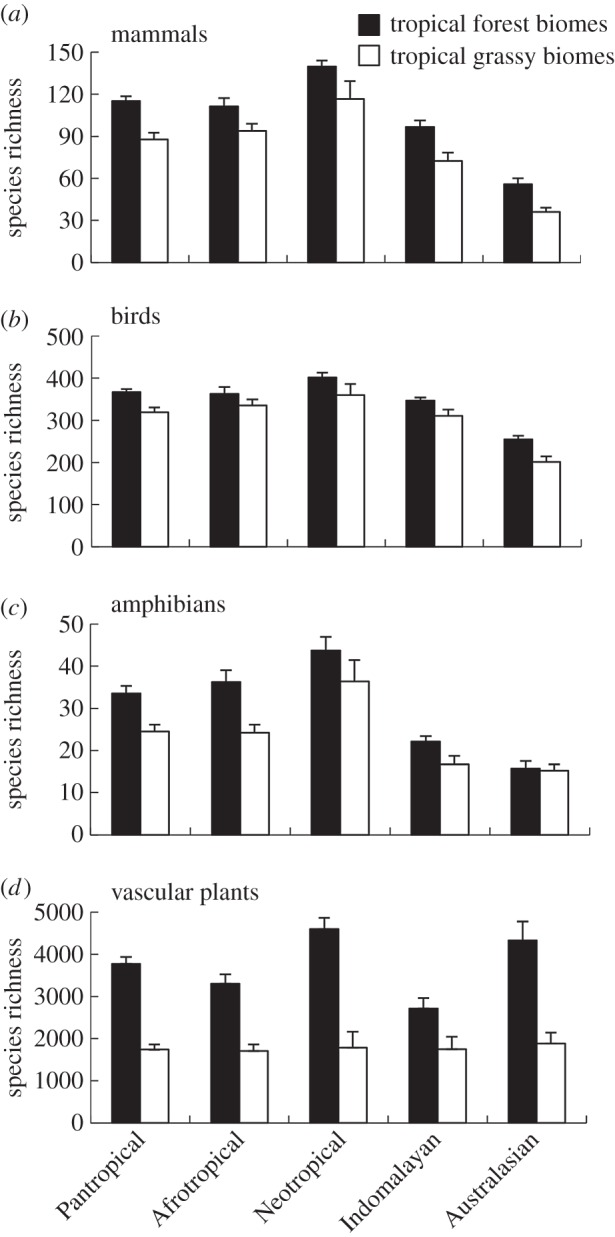
Figure 3.

Comparison of species richness between tropical forest and TGBs in each biogeographic realm, for key vertebrate groups: (a) mammals, (b) birds and (c) amphibians, as well as (d) vascular plants. The means are calculated from the values for each tropical ecoregion. The error bars indicate standard error of the mean (of ecoregions).
