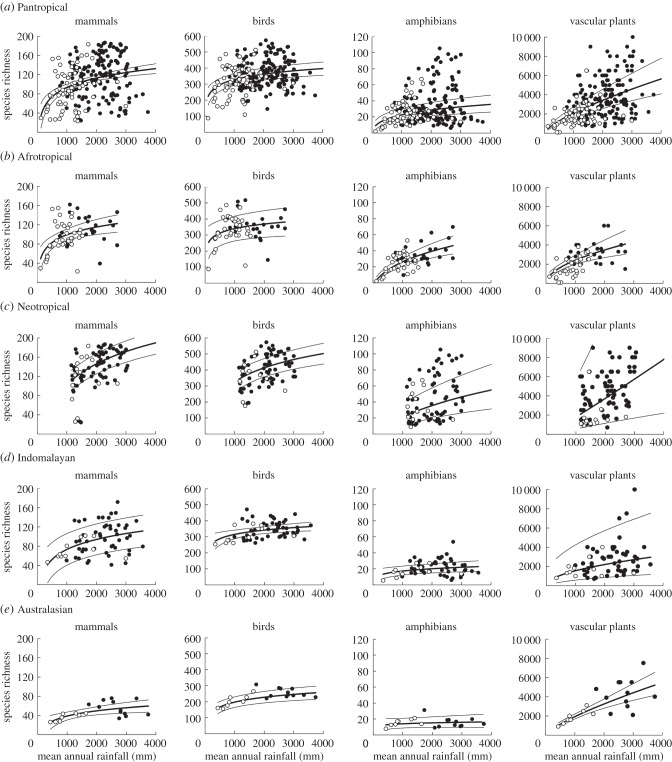
Figure 4.
The relationship between mean species richness and mean annual rainfall, for key vertebrate groups (mammals, birds and amphibians) as well as vascular plants, shown for (a) the whole tropics (pantropical), and (b–e) separately for each tropical biogeographic realm. Each data point represents either the mean of 10 × 10 km cells (for vertebrates) or the total (for plants) species richness for an ecoregion. The open circles indicate TGBs, and the filled circles indicate forest biomes.

