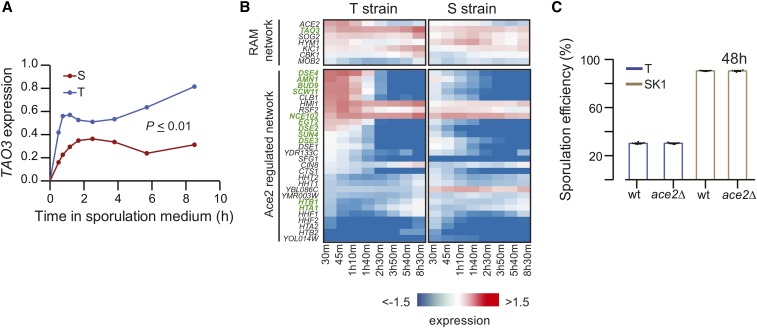
Figure 2.
The role of TAO3 in meiosis is distinct from its role during mitosis. (A) Expression profile (log2 fold change t0) of TAO3 is given in the y-axis for the T (purple) and S strains (red), and the x-axis denotes the time in sporulation medium (data in Table S1 and Table S11). (B) Heatmap showing gene expression of RAM network genes and Ace2-regulated genes in the T and S strains. Gene names in green show differential expression (data in Table S1 and Table S11). (C) Bar plots represent the mean sporulation efficiency after 48 hr of the SK1 and T wild type (wt) and ace2∆ deletion strains. Pair and interaction tests (Materials and Methods) were performed to test significance.

