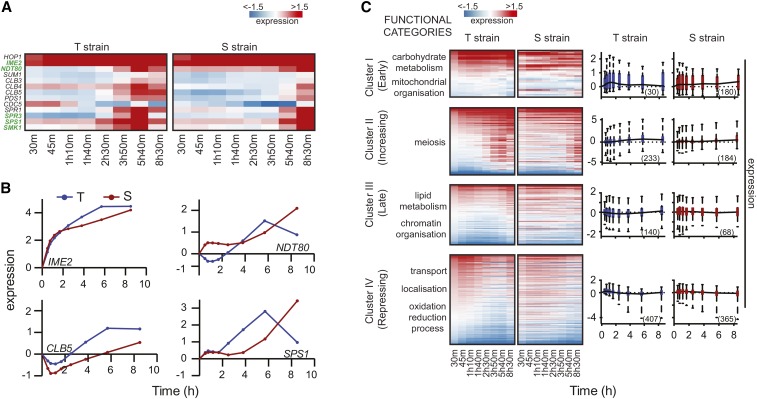
Figure 3.
Global gene expression variation in presence of causative TAO3 allele. (A) Temporal heatmap of meiotic genes in the T and S strains. The gene names shown in green are differentially expressed in the presence of TAO3(4477C). (B) The expression profile (log2 fold change t0) for the meiotic landmark genes is given in the y-axis, and the x-axis denotes the time in sporulation medium. The red line represents the expression profile of the respective gene in the S strain, and the blue line is the same in the T strain. (C) Heatmap of the T and S strains showing differentially expressed genes across time, clustered according to expression profiles in T strain. Each row represents a single gene, and columns are time points of each strain (for gene list in each cluster, see Table S2). The order of genes is based on clustering of the T strain. Both the heatmap and boxplot consists of genes in each cluster of the T strain, and represent their expression profiles in both T and S strains. Functional GO categories of genes in each cluster of T strain are shown on left. The boxplots on the right represent the average expression profile of each cluster in the T, and the same genes in S strains. The number of genes in each cluster in a strain is indicated in brackets.

