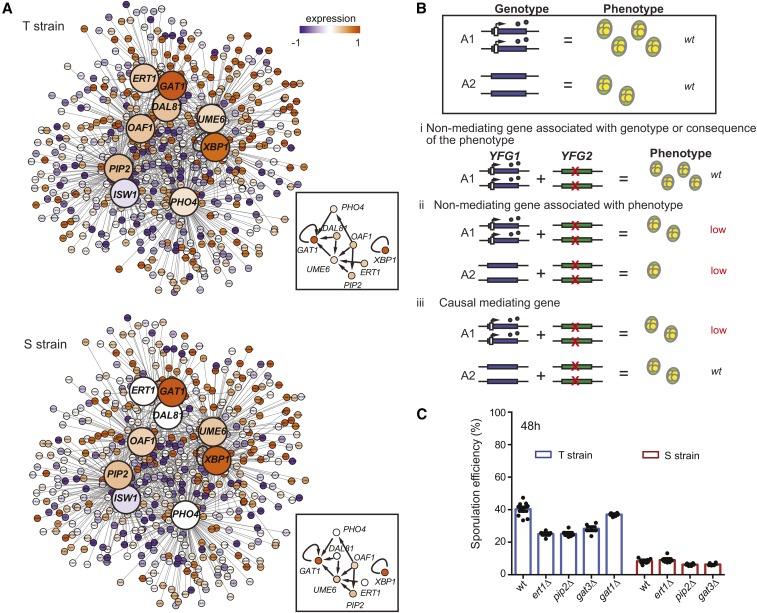
Figure 4.
Identifying candidate genes mediating the allele-specific effects of TAO3 during sporulation using the temporal gene expression data. (A) Regulatory network of candidate genes predicted to mediate the effects of TAO3(4477C) in sporulation. The candidate mediating genes are shown as bigger nodes (large circles), with their target genes (small circles) connected to them as straight lines. The box contains the protein network interactions of the candidate genes with the core sporulation gene UME6, obtained from YEASTRACT (Materials and Methods). Colors inside the nodes were calculated as an average of the first six time points in sporulation (early phase). For a complete list of interacting genes and their expression values, see Table S5 and Table S11, respectively. (B) Genetic model for functional validation of allele-specific interactors mediating sporulation efficiency variation. The wild type effect comparison of the two alleles A1 and A2 of the YFG1 gene is shown inside the box. A1 is associated with high sporulation efficiency (wild type genotype and phenotype shown), and A2 is associated with low sporulation efficiency (wild type genotype and phenotype shown). Genetic interaction of these YFG1 alleles with candidate mediating genes (YFG2) is represented: (i) representation of nonmediating gene associated with genotype only, or is a consequence of the phenotype, since yfg2∆ in the presence of A1 does not affect the wild type phenotype of A1; (ii) representation of nonmediating gene associated with the phenotype independent of the allele, since yfg2∆ in the presence of both A1 and A2 lowers (low) the phenotype; (iii) representation of causal mediating gene since yfg2∆ only in presence of allele A1 lowers the phenotype, and in the presence of allele A2 does not change the wild type phenotype of A2. (C) Bar plots represent the mean sporulation efficiency after 48 hr of the T and S wild type (wt), and the ert1∆, pip2∆, and gat3∆ strains. Pair and interaction tests (Materials and Methods) were performed to test significance. For the T strain, gat1∆ was nonsignificant, but ert1∆ (P = 2.1 × 10⁻¹²), pip2∆ (P = 6.1 × 10⁻¹³), and gat3∆ (P = 9.6 × 10⁻¹⁰) significantly reduced the mean sporulation efficiency. Significant interaction terms were obtained between the genetic backgrounds (S and T) and ert1∆ (P = 2.3 × 10⁻⁴) and pip2∆ (P = 0.04).

