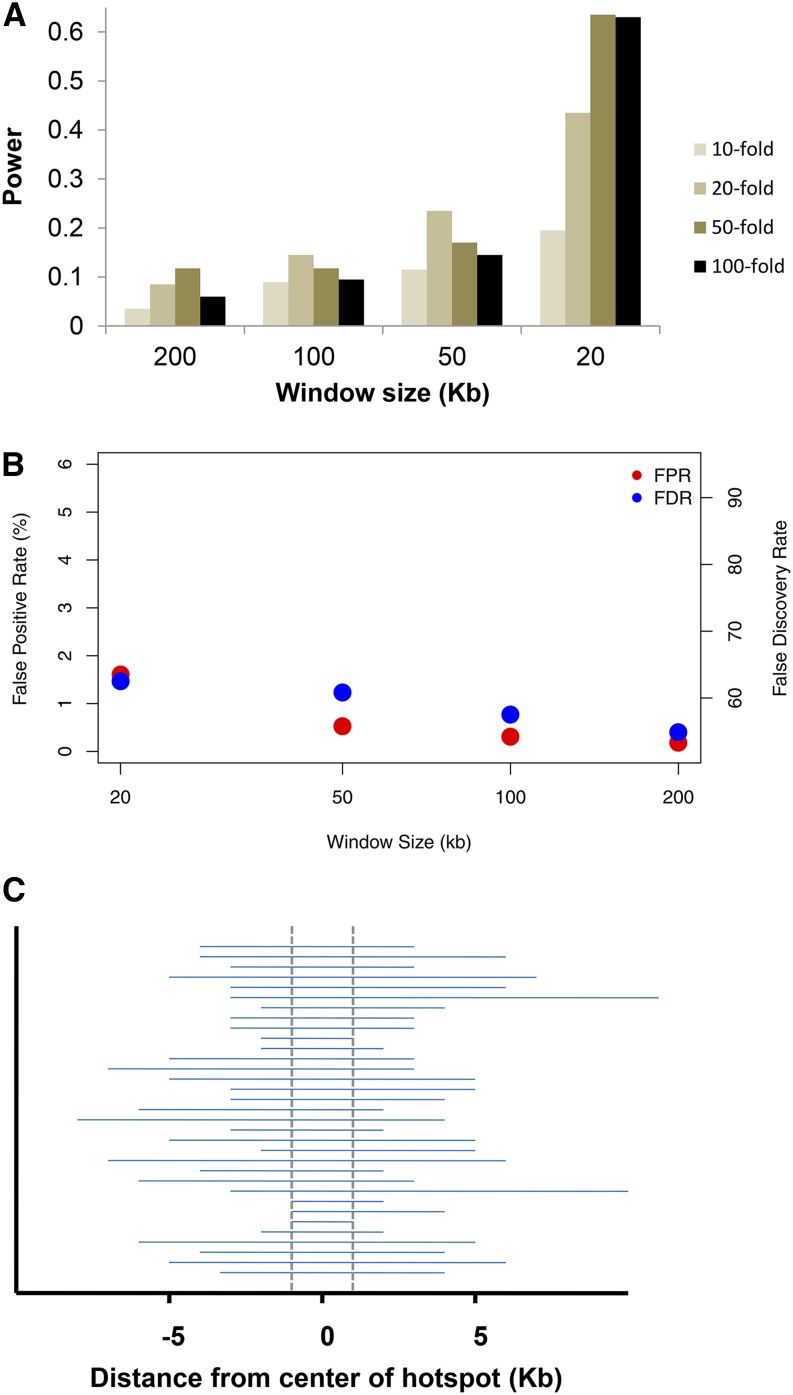
Figure 1.
(A) Power to detect a hotspot as a function of the window size (x-axis) and the strength of the hotspot using the protocol of Auton et al. (2012). Background ρ is 0.5/kb. See text for further details. (B) False positive rate for estimated hotspots, defined as the proportion of estimated hotspot sequence that was not actually a simulated hotspot. (C) Estimated hotspot locations without the length limitation for a 100 kb window and a 50-fold hotspot. Dashed vertical lines show location of actual hotspot. Results are similar for other parameter combinations.

