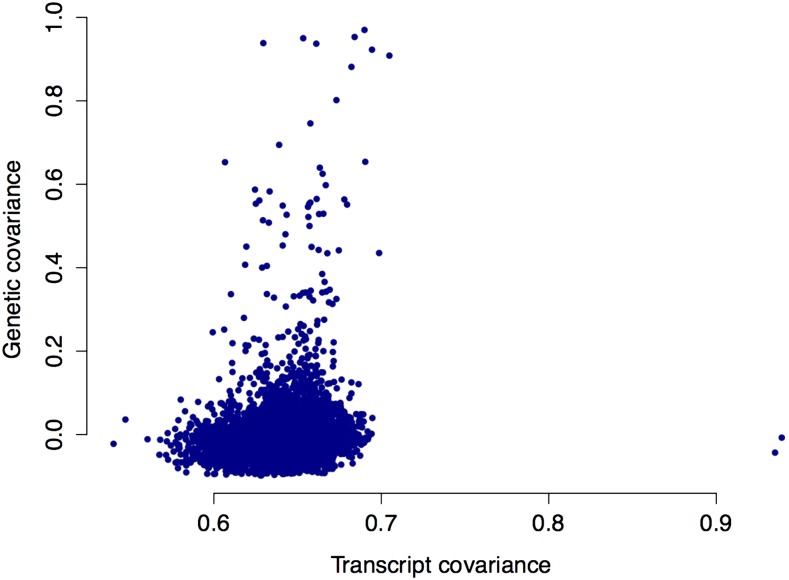
Figure 3.
Correlation between the genetic and transcriptome covariances among 4317 genes with transcripts detected in between 14 and 126 of the accessions in the SCHMITZ-data, and that are expressed above a level where transcripts RNA-seq have been able to detect transcripts for a gene in all accessions. Each dot in the figure represents a pairwise relationship between two accessions, with the transcript covariance on the y-axis and the genetic covariance on the y-axis.

