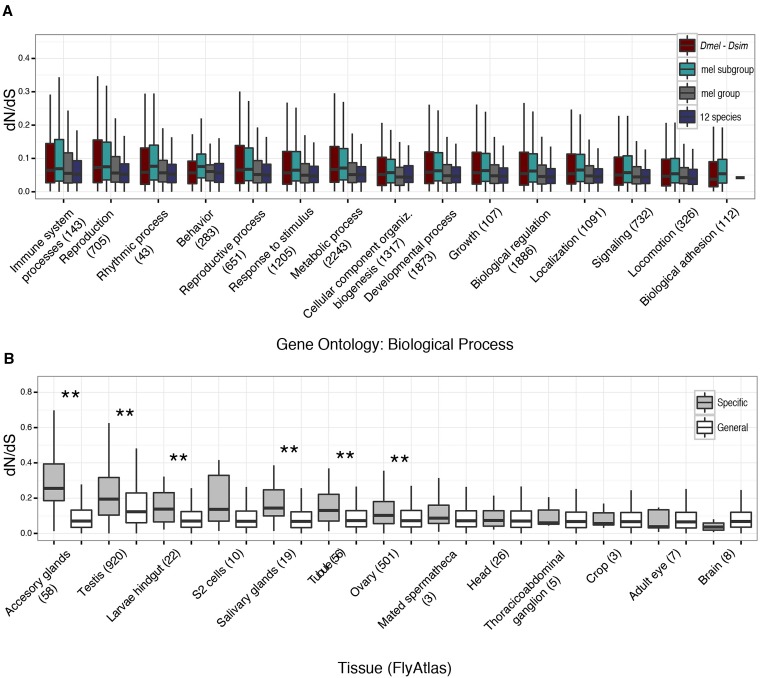
Figure 4.
Functional analysis of divergence. (A) Gene ontology comparison for each of the four datasets showing the individual distributions of dN/dS in the top hierarchical ontological categories of Biological Process and rank ordered according to divergence. (B) Ranked distribution of dN/dS in selected tissues in the melanogaster group dataset. Genes labeled as “general” are expressed in > 50% of the examined tissues (open) and genes labeled as “specific” are expressed in a single tissue (gray). Tissue expression data taken from FlyAtlas (Robinson et al. 2013). Astericks denote significant difference between general and specific tissue-expressed genes; ** P < 0.001, Wilcoxon rank-sum test.

