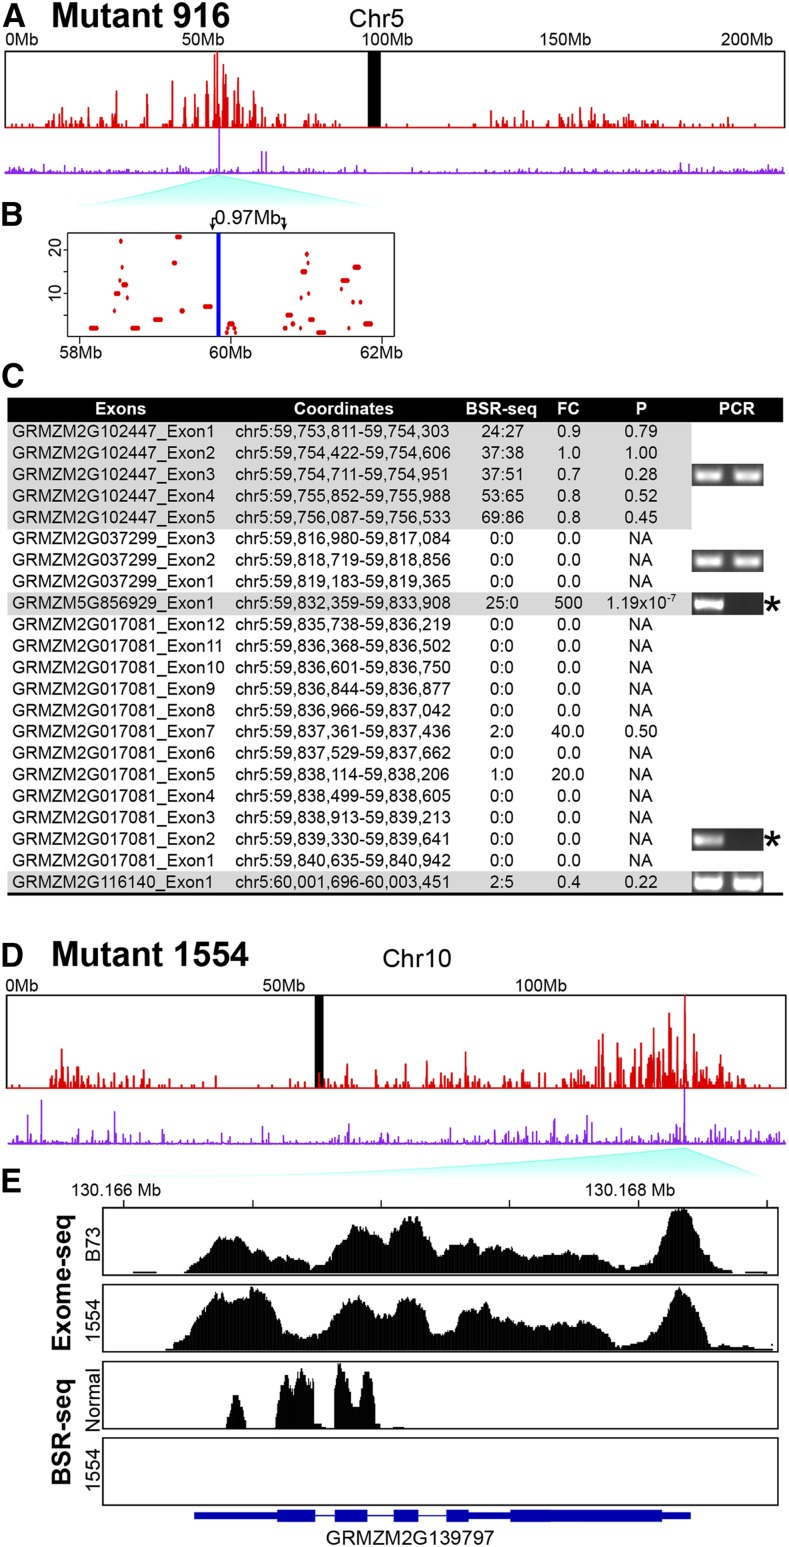
Figure 3.
BSR-seq linkage analysis identified causative gene candidates in mutants 916 and 1554 using expression ratio. Expression difference overlapped with linkage peaks on chromosome 5 in mutant 916 (A) and on chromosome 10 in mutant 1554 (D). Red bars: numbers of positive SNP/indel in sliding-window of 100 kb with a step of 10 kb; purple bars: fold-change of gene expression values between mutant pool and normal pool based on BSR-seq reads; black bar: centromere. Y axis scale for positive SNPs/indels ranges from 0 to 23 and 31 in mutants 916 and 1554, respectively. (B) An enlargement of the highest linkage peak region, 58–62 Mb, was shown in mutant 916, in which a gap (∼0.97 Mb in blue) contains the causative deletion. (C) PCR verification of a causative deletion containing two genes on chromosome 5 in mutant 916. Normalized numbers of read counts of normal type (N) and mutant (M) were shown. Expression fold-changes (FC) defined as N/(M + 0.05) and P-values calculated by R package DESeq, were used to search for deleted exons. The verified deletions are noted with an asterisk. (E) The mapping coverage of the gene GRMZM2G139797 in exome-seq and BSR-seq are visualized.

