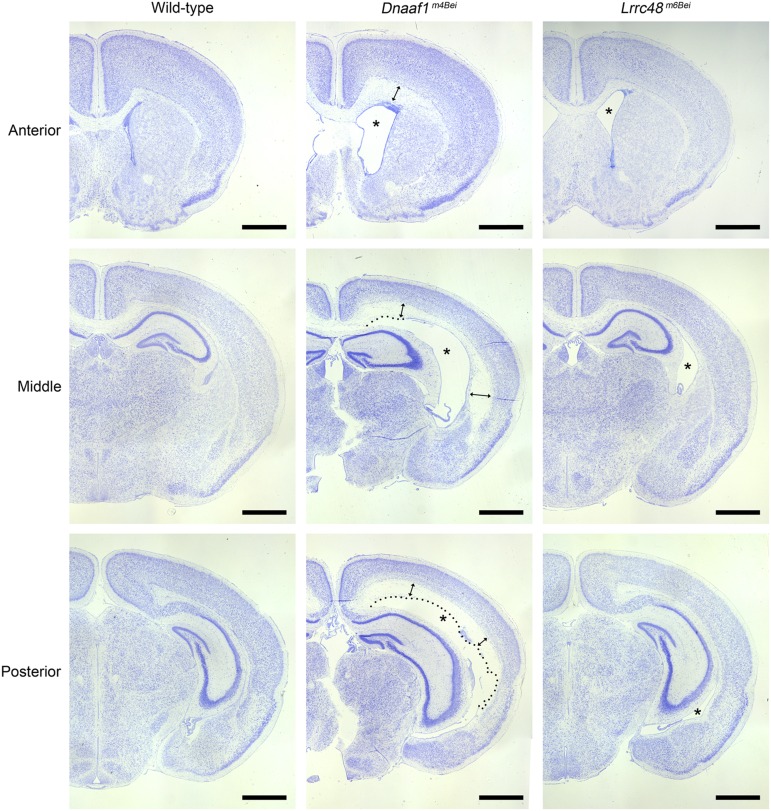
Figure 2.
Hydrocephalus phenotype. Nissl-stained images of coronal sections are shown. Enlarged lateral ventricles are marked with asterisks. Enlargement of the third ventricles is also evident in both mutants. Dotted lines in Dnaaf1m4Bei mutant images indicate disruption in ependymal lining. Double-headed arrows indicate transependymal edema. Scale bars, 1 mm.

