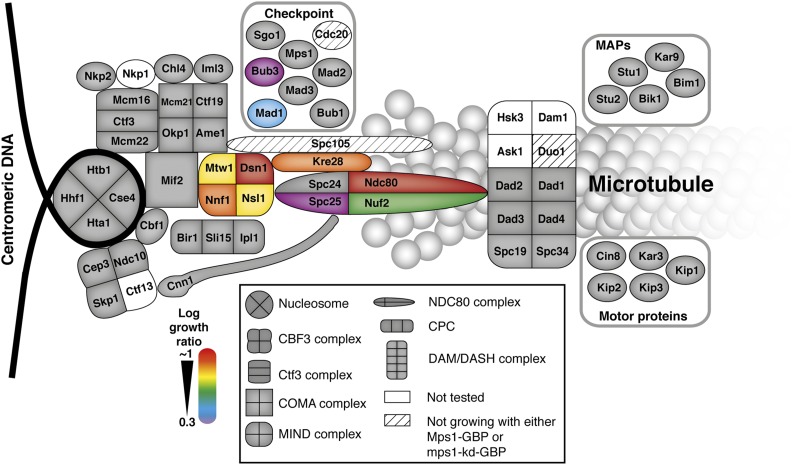
Figure 6.
Map of Mps1 kinetochore SPIs. A schematic of the kinetochore proteins illustrates those proteins that when associated with active Mps1 lead to growth arrest. These proteins are predominantly within the KMN network of mid to outer kinetochore proteins, adjacent to Spc105. The strength of the SPI is color-coded, red strongest, purple weakest.

